
Here is an unanticipated installment 3.
We’re investigating the interesting claim that higher variance in game-by-game performance amplifies starting pitcher value—or at least sometimes does.

So far we’ve probed it with empirically realistic simulation and two historical-data analyses.
The conclusion from those inquiries was that starter variance likely does generate some value above and beyond starter runs avoided. But the amount of value is exceedingly small—at best on the order of 1 win per 162 games—and cannot be credibly detected within a practical decision frame (not at the level of a single season or even multiple ones).
 Now we’ll take a look at another pitcher value estimator that was designed to be specifically responsive to the extra value that starter variance imparts: Grid WAR.
Grid WAR is the invention of Brill & Wyner, who are the most systematic defenders of the “variance value added” (VVA) thesis. Unlike most pitcher-value estimators (e.g., FIP or old-fashioned ERA), Grid WAR is not a runs-allowed rate statistic. Instead it effectively attributes a fraction of a “win” (positive or negative) to a starter in every outing based on the expected outcome given the state of the game (innings thrown, runs allowed, runners on base) when he was removed or his complete-game appearance ended.
It is pretty obvious, then, how Grid WAR is geared to capturing the VVA that ordinary pitcher-value estimators miss. Under Grid WAR, a starter’s value at the end of the season consists of the sum of all his season outings, and hence tracks the differences in quality across them. Any runs-saved/allowed measure that is based on FIP or RA9 (or, shudder, ERA) averages away all of those ups and downs.
So here’s another test we can run: see how Grid WAR does in predicting pitcher value comparted to the best rate-statistic ones. If Grid WAR doesn’t outperform them, that will be strong, if not decisive, evidence against that the VVA thesis.
If Grid WAR does empirically outperform the best rate-statistic measures of pitcher value, then that’s evidence that VVA matters–but it’s ambiguous. The reason such a result isn’t clean proof is that Grid WAR is just different from the other metrics; it might do a better job than they do for reasons having nothing to do with its responsiveness to variance.
The only way to remove that ambiguity would be to see if starter variance, measured independently of Grid WAR itself, predicts higher Grid WAR scores and explains the difference between Grid WAR and the other measures.
But there is still the possibility of learning something of value, so I decided to run this test.
Because we can’t directly observe pitcher value, the only way to validate a pitcher-value estimator is to aggregate teams’ individual pitcher scores and see if those sums explain observable team-level outcomes that depend on the value of the teams’ pitchers.
I did that for three estimators: Grid WAR; FanGraphs’ “pitcher runs [saved] above replacement”; and eFIP pitcher runs saved.
First, I aggregated every team’s individual starting pitcher scores for each metric for all AL/NL seasons between 1952 (the first season for which Grid WAR data are available online) to 2025.
Second, I created a model for estimating team winning percentage based on total runs scored, fielding runs saved, and reliever runs saved per inning (as measured by eFIP). This model furnishes a baseline of expected team performance before starting-pitcher value is considered.
Third and finally, I added to that model, in turn, each of the three team-level pitcher-value scores—so that we could see how much incremental variance each one added to that baseline prediction of team performance.
Here’s what I found:
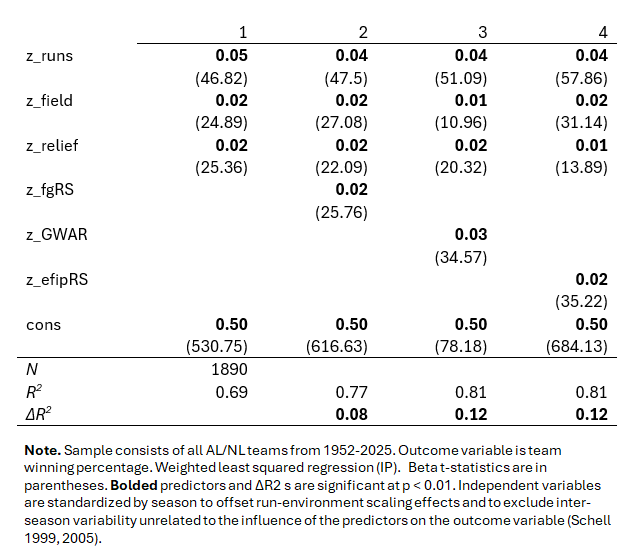
The baseline model—team offense, team fielding, and team relief pitching—explains 69% of the variance (R2) in team winning percentages.
Against that baseline, Grid WAR does outperform FanGraphs’ starter pitcher runs saved: whereas the latter increases variance explained 8 percentage points (to 77% overall), the latter increases it by 12 percentage points (81%).
But Grid WAR doesn’t outperform eFIP (which as we already know is a better estimator than FG’s “runs [saved] above replacement”): eFIP increases the baseline variance explained by 12 percentage points too.
So that’s good news but also bad for Grid WAR. Good because Grid WAR does just as good a job as eFIP, which as I’ve discussed is an enhanced variant of FIP.
 But bad because eFIP, like ordinary FIP, is starter variance blind. It only cares about how many runs a pitcher saves—over an inning, game, a season, or a career, depending on how it is operationalized (here season)—and has no cognizance of how evenly or unevenly those run-suppression effects are parsed out over starts. Since Grid WAR did no better in measuring pitcher value than eFIP, that’s a strong strike against the claim that starter variance contributes to team performance over and above the total quantum of season runs that starters manage to suppress.
Now as I said, this result—Grid WAR doesn’t outperform a rate-statistic pitcher-value estimator—is strong but not decisive evidence against the VVA position.
The reason, again, is that Grid WAR is simply different from eFIP. Maybe Grid WAR has some hidden defect that is holding it back generally and obscuring the value that its variance sensitivity is making to its overall performance.
But I seriously doubt that. First, it seems super unlikely to me that Grid WAR has any particular defect in it; it makes a ton of sense to me, in fact!
And second, the last two posts already tackle the VVA thesis head-on. They show that when variance is measured independently of the estimator in question, it matters a bit, but too little to be of practical value. So I’d be pretty surprised if there is some reservoir of hidden VVA in Grid WAR that has managed to avoid being detected here.
But hey—I’m still mulling.
And if you have anything to say about this that might enlighten me and even change my mind completely, please do! To facilitate that, I’ve included the data I used for the analyses in the data library. Have at it!