
 So here is a fun follow-up to the last post.
That one introduced “eFIP,” a pitcher estimator that uses empirically derived weights for fielding-independent outcomes—strikeouts, walks, home runs allowed, and hit batters.
I outlined its derivation and explained how it can be used to form an expected runs-saved per inning estimator. Then I showed that it is more reliable (that is, consistent in its individual pitcher measurements, season over season) and more predictive of team pitching-runs saved, out of sample, than either Baseball Reference’s or FanGraphs’ runs-saved measures, which form the foundation of their respective pitcher war measures.
The predictive advantage of eFIP can be amplified by use of empirical Bayesian methods—but I’ll leave that for another day!
For now let’s look at some individual pitcher rankings.
First, here are the top 50 individual eFIP team-value-added seasons (post 1900). They are “team value added” in the sense that they combine pitching proficiency under the eFIP runs-saved per inning estimator with workload to determine team wins produced.
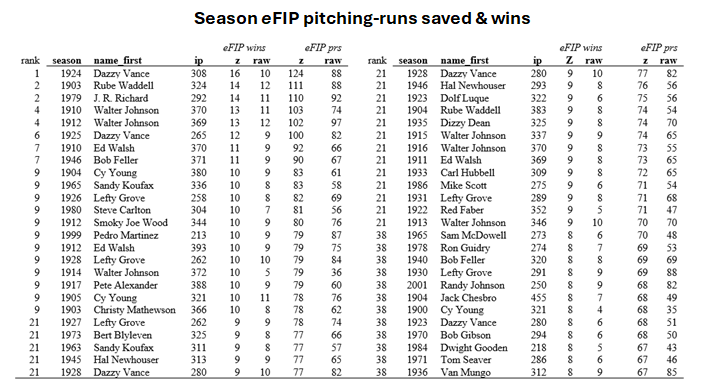
The overall rankings are for season-standardized team wins added. Because of rule-changes, innovations in equipment, improved playing conditions, and other extraneous influences, baseball-performance metrics will naturally jump around a lot for reasons having nothing to do with player skill. Standardization is a statistical technique that adjusts for shifting means and variances and puts individual-performance metrics on a common scale across baseball eras. For a brilliant use of this technique, check out Michael Schell’s work on baseball’s greatest hitters.
The season-standardized measures of eFIP wins added are reported in the “z” column. I’ve described at the end of the post how these values were formed. For comparison, the “raw” score, reflecting the unstandardized number of eFIP wins added, is also reported. This is how many wins a pitcher is estimated to have contributed to his team’s record without any era adjustments (see methods notes below).
There also corresponding season-standardized (“z”) and raw season total pitching runs saved. (Again, see the notes below for calculation method: the raw “wins added” uses the season-specific mean team runs scored and allowed, and the standardized measure the AL/NL historical season means, to calculate how runs savings of the indicated magnitude would be expected to affect the records of teams that otherwise would have .500 records.)
One can figure out career team-value added by summing the season team-wins added. Again, there are standardized (“z”) and raw variants. Here are the top 100.
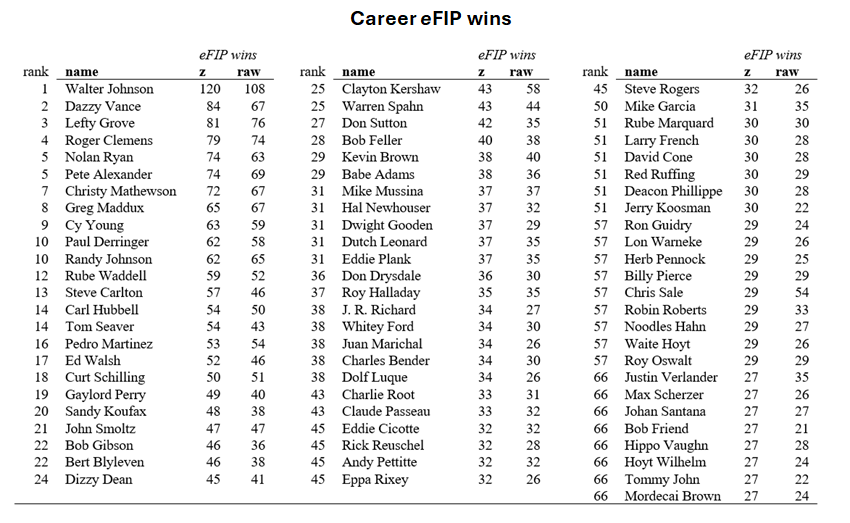
Note that total eFIP wins will be lower than FG and BBR WAR ones because eFIP ones are “above average,” not “above replacement.” In my view, the latter benchmark is arbitrary and uninformative, since no one genuinely knows what a “replacement” performance level is, and even if anyone did, it is merely a mathematical recentering of marks on the “wins above average” scale.
I’ve said enough.
 But I’ll close by noting the Dazzy Vance is definitely an under-rated pitcher! Metrics like ERA and strikeouts grossly understate his effectiveness because he played in era in which run scoring was super high and batters weren’t nearly so swing-happy as they have progressively become over baseball history. But if one considers him with appropriately formed, era-neutral estimator metrics, he outclasses everybody with the exception of Walter Johnson.
Method notes
1. Raw eFIP. The method for forming raw eFIP was discussed in detail in the last post. It uses regression-derived weights to estimate how many runs pitchers are responsible for based on their strikeouts, walks, home runs allowed, and hit batters per IP. The result is a per-inning measure of how many runs a pitcher is expected to be responsible for independently of fielding support. Raw eFIP is that total multiplied by 9 to put it on a “per game” scale.
2. Raw eFIP Pitching runs saved. Pitching runs saved consist in the absolute number of runs pitchers avoid. To determine a pitcher’s raw season total, his eFIP-derived “runs-saved per inning” is, first, multiplied by the number of innings he pitched and then subtracted from the number that a pitcher with the league mean eFIP would have saved over the same number of innings. A pitcher’s career pitching-runs saved is the sum of his all of his individual season pitching-runs-saved totals.
3. Raw eFIP wins added. Raw eFIP wins are based on the conversion of raw eFIP pitcher-runs saved into team wins. The impact of pitching-runs saved is estimated using a .500 team baseline. Start with the mean number of runs scored and allowed for a .500 team in the season in which the pitcher played; subtract the pitcher’s estimated pitching-runs saved from the .500 team’s runs allowed; recompute the teams Pythagorean Expectation winning percentage; and then apply that winning percentage to the number of games the pitcher’s team played. The difference between that new expected number of team wins and .500 team’s wins is treated as the pitcher’s “wins added.”
4. Standardized pitching runs saved. To start, every pitcher gets a season-specific, innings-pitched runs-saved z-score: this is how many season-weighted standard deviations separate that pitcher’s raw, per-inning pitching-runs saved score and the season-weighted league mean, which is always zero by design. This puts scores across all seasons on a common scale: the higher the z-score the more dominant a pitcher was in his season; the lower, the more mediocre. To make performances on this scale more interpretable, pitchers’ z-scores are multiplied by the mean of all the season-weighted standard deviations: the results are the pitchers’ per-inning runs saved within the AL/NL historical “average” run environment. Multiply each pitcher’s result by his innings pitched in the season in question, and the result is his standardized, “average run environment” season pitching-runs saved.
5. Standardized wins added. The same operation to convert raw pitching-runs saved into wins is now performed on every pitcher’s standardized pitching-runs saved. The baseline now is a team that scored and allowed 700 runs—essentially the “average” number for a .500 team over AL/NL history. The pitcher’s standardized season runs saved are subtracted from the “historically average” .500 team’s 700 runs allowed; the team’s Pythagorean Expectation winning percentage recomputed; and that winning percentage applied to a 162-game total. The difference between the new total wins and 81—the number the “historically average” .500 team would have won in 162 games—is the pitcher’s standardized wins added. This scale is now era invariant, too, and reflects the the AL/NL “historical” run environment. The pitchers’ career total standardized wins are again just the sum of their season totals—here measured on the standardized scale.
One Response
Disgusted by the mike mussina erasure.