
This might seem like a silly question, but it’s actually a very interesting one.
Imagine two pitchers, Reliable and Erratic, both of whom pitch for a team that scores an average amount of runs—say 4.5 or so—per game.
Say a typical 6-game strict for each looks likes this:

Okay. They’ve both pitched 36 innings and allowed 18 runs—or 4.5 per 9 IP.
 But it probably seems pretty clear that Erratic generated more value. He was dreadful in one of his outings. But in the others he went deep, and left having given up fewer runs than his own team scores on average in the same number of innings. Erratic thus conferred on his team the opportunity to win five of his six starts so long as they played average ball behind him.
Reliable, in contrast, never blew up. But in every one of his starts he allowed the same number of runs that his own team likely would have pushed across the plate in the same number of innings. If the team plays average when Reliable is on the mound, they will likely win about half the time.
Not all runs allowed—or better still, prevented—are created equal. The ones allowed in games where a team has already fallen far behind are pretty much costless; or at least they cost the team a lot less than the ones given up while a win remains a live possibility.
So all else equal, the pitcher who allows runs in bursts between decent stretches of superior pitching is going to have given up fewer costly runs than the one who steadily dolls out opponent runs at a rate that consistently rivals the number his own team can be expected to put on the scoreboard.
The idea that inconsistency in allowing runs might be good has been kicking around for at least a couple of decades. Sabermetricians came to opposing conclusions.
But the thesis got a really strong boost recently in a paper by Brill and Wyner. The conclusion that high-variance pitchers are undervalued is at the heart of a new starting-pitcher estimator that they developed called “Grid War.”
The paper is a great one.
But I’m not 100% sure it settles the question of whether inconsistency is better. B&W showed that their Grid WAR estimator is internally valid but didn’t actually present any empirical evidence to confirm that it does a better job in explaining or predicting how starting pitchers contribute to team wins than systems that are variance indifferent.
This actually ties into the question that I’ve been looking at for a while on “Pythagorean Expectation Benchmarking.” This is the idea that certain elements of team composition contribute to team success in a manner that allows them to “beat” their Pythagorean Expected (PE) winning percentage, which as you know is based on the formula
 where WP is winning percentage, RS runs scored, RA runs allowed, and λ a run-scale specific exponent set to either 2 or, if one wants to be even more precise, 1.8.
Brill and Wyner don’t explicitly argue that high variance starting pitching of the sort rewarded by Grid War makes a team “beat” PE. But that’s the necessary implication of their claim. PE measures contributions to wins based solely on runs scored and allowed. But on B&W’s account, starters who display higher variance in runs allowed are more valuable to their teams—more likely to generate wins for them—than pitchers who allow the same number of runs but with lower variance.
So I decided to investigate the idea that high variance in starting pitching can generate more wins than we’d expect under PE. And my conclusion is that as cool as the theory behind it is, staring-pitcher variance is very unlikely to affect pitcher value to a material degree.
I’m going to present my evidence in two installments. In this one, I’ll report the results of a simulation driven by actual MLB scoring data and designed to supply an empirical answer to the question of how differences in variance affect team winning percentages.

Using MLB 2010-2025 (excluding the 2020 COVID-shortened season), the simulation empirically maps runs-per-game variances to mean runs allowed per game by MLB teams. It then examines how the records of teams whose runs-allowed variances are high compared to the records of teams whose runs-allowed variances are set to the MLB median level. Mean runs scored and allowed per game are held constant for the two teams. The comparison is then calculated in relation to the teams’ PE-predicted winning percentages—so we can answer the Pythagorean Benchmarking question: do teams that have high (here MLB 75th percentile) variance runs-allowed variance do better than teams with normal (50th percentile) runs-allowed variance?
In fact, I do this at various levels of both team mean runs allowed and team mean runs scored—to see if the benefits of high variance in runs allowed vary depending on how good team pitching and hitting are.
Note in this simulation, runs-allowed variance is not measured in relation to pitcher starts—B&W’s focus. Instead, it is measured in relation to team games.
But that element of the simulation makes it even more favorable to the claim that high variance is a beneficial starter characteristic. The impact of starter variance will inevitably be diluted by inconsistencies in relief-pitcher effectiveness, which determines whether the benefits of games in which starters perform well are fully realized. That’s not an issue when variance in runs allowed is examined at the game level. Effectively, it is as if variances in starters and relievers were perfectly aligned, with relievers pitching exceptionally well and pitching exceptionally poorly whenever the starter does. As a result, the simulation even more cleanly extracts the impact of runs-allowed variance on a team’s deviation from PE than does an empirical examination confined to the impact of starting-pitcher variance.
The simulation works by replaying 162-game seasons 10,000 times for teams at each of the specified combinations of runs-scored means (19 of them, across the distribution of runs-per-game distribution for 2010-2025 teams), runs-allowed means, and runs-allowed variances. Runs scored and allowed are drawn at a game level from distributions weighted to reflect the specified empirical relationship between those means and variances. The result is a set of counterfactual seasons that reflect a realistic impact of runs-allowed variances on team records. If you want to see the methods in exacting detail, check out the Supplemental Information to the latest version of “Against Pythagorean Benchmarking.”
Here is what we see:
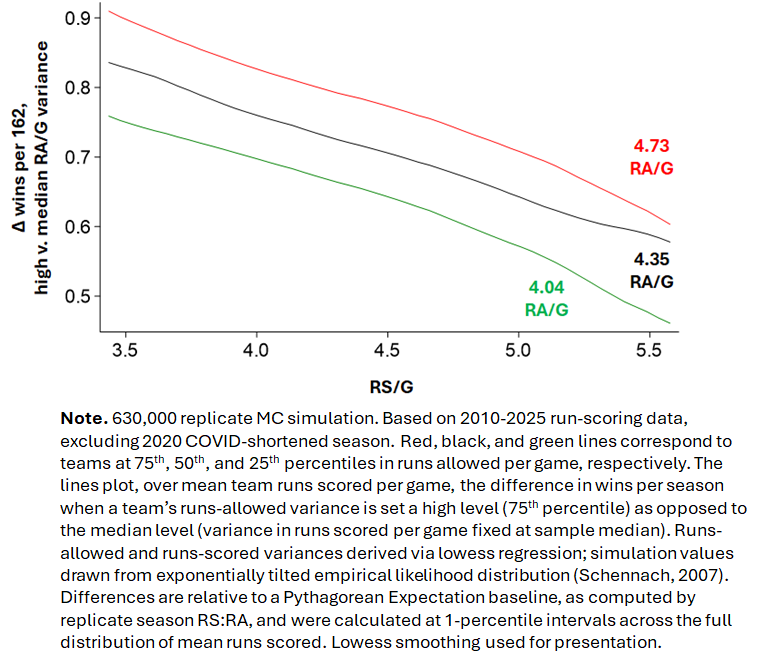
The results confirm that a high team runs-allowed variance does improve team records relative to team PE-predicted winning percentages. The results also show that that such effects interact with mean runs allowed and runs scored. The effect of a high versus a median runs-allowed variance is uniformly bigger for teams with inferior (75th percentile), and uniformly smaller for teams with superior (25th percentile), runs-allowed means; middling teams (50th percentile runs-allowed means) fall in between. At all levels of runs allowed, moreover, the benefit of runs-allowed variance shrinks as team run-scoring means increase. In other words, the benefit of high variance in runs allowed is greatest for teams with the weakest pitching and hitting, and smallest for ones with the strongest pitching and hitting.
Note, though, the minuscule size of the benefit associated with high runs-allowed variance. Teams with median runs-allowed variances perform consistently with their Pythagorean Expectation winning percentage; accordingly, the Pythagorean Expectation gain for high-variance teams is effectively the advantage they enjoy over their otherwise like-situated median-variance counterparts. Even for a team with the weakest pitching and hitting, the Pythagorean Expectation gain approaches only 1 win per 162 games; for stronger teams, the gain is estimated to be even smaller.
It’s hard to believe that any practical decisionmaker—say a team manager or GM—would view effect sizes this small to be of consequence when appraising the value of different pitchers.
But even more tellingly, it’s almost certain that such decisionmakers would not be able to confidently detect sizes this small in the real world. In “Against Pythagorean Benchmarking,” I identify a Minimum Detectable Effect size that is sensitive to the irreducible noise that attends PE itself. An impact of 1 game per 162 falls well short of what would be required to be confident than any deviation from PE is a real, non-chance one.
That’s a matter I’ll address in the next post on this topic. There I’ll report a study using historical team data that seeks to determine whether team-starter variance generates deviations from teams’ PE-predicted winning percentages.
One thing to point out too: my analyses here are always provisional. Like all of you, I’m trying to learn from data how baseball really works. If I discover or anyone (such as B&W) show me a conclusion I’ve reached is wrong, I’ll revise my views. That definitely happens! And I’ll tell you whenever it does!