
Geez—I really didn’t think I’d end up thinking and writing so much about starter variance! But here is instalment no. 4.
You know the setup. The records of Mr. Reliable and Mr. Erratic illustrate how, in principle, an inconsistent pitcher might be more valuable than a consistent one holding runs allowed per inning constant. By concentrating his runs allowed in a smaller number of games, the higher variance starter (Erratic), gives his team a higher chance to win in the remainder, in which he necessarily surrenders substantially fewer runs than the low-variance pitcher (Reliable), who spreads his runs allowed evenly across starts.

That’s the theory, as it were. But is it empirically true? What does actual data say about the “variance value added” (VVA) conjecture?
Installment number one in this series constructed a non-parametric, data-driven simulation of the effect of variance in runs allowed. It showed that a team with exceptionally high variance in runs allowed per game could be expected to garner 1 additional win per 162 games—but only if that team allowed a high number of runs and scored a low number per game on average, or else such variance would matter even less.
 Installment number two examined how differences in starting-staff variance have affected the records of teams historically. Using two empirical null baselines, the analysis concluded that there was essentially no detectable evidence that variance exerts any impact on winning percentage beyond what’s accounted for by the Pythagorean Expectation formula, which is based solely on runs scored and allowed.
Installment number three examined Brill & Wyner’s Grid WAR measure of starter value.
A very elegant metric, Grid WAR measures starting pitcher value by computing in every game he pitches the marginal impact of his performance on his team’s probability of winning. Because it tallies pitcher impacts game by game, Grid WAR captures the effect of variance that evaded measures like FanGraphs’ and Baseball Reference’s WAR systems, which are based simply on the rate at which a pitcher allows runs without regard to how those runs are spread out.
Nonetheless, installment number three found that Grid WAR enjoyed no explanatory advantage over a variance-insensitive metric of starter value—eFIP. Like FanGraphs’ and Baseball Reference’s WAR measures, eFIP is based on the simple rate at which a pitcher suppresses runs per inning, although it uses an empirically enriched version of “fielding independent pitching” to figure that out. Holding teams’ offensive, fielding, and relief-pitching capacities constant, Grid WAR’s and eFIP’s assessments of team starting-pitcher proficiency were equally good at predicting team winning percentages.
Okay, now what?
Well, we know, based on installment no. three, that Grid WAR does no better than variance-blind eFIP in explaining the contribution of starting pitching to team records. But we don’t know whether this is so because Grid WAR, like eFIP, is doing a really good job at tracking pitchers’ run suppression propensities or is instead compensating for a deficiency in that department with its unique sensitivity to starter variance.
So I decided to directly investigate the question, What does variance sensitivity contribute to pitcher Grid WAR scores? The answer is nothing, or at least nothing that can be empirically detected.
One terminological note to start. Under B&W’s framework, every start generates an incremental probability of a team win. They refer to this as a “game-level Grid WAR” or “game-by-game Grid WAR.” That is different from what they call “season aggregate” or “cumulative Grid WAR,” which is the sum of all a pitcher’s game-level scores and which reflects expected team wins added by that pitcher over a season.
I will be using “Grid War scores” to refer pitchers’ season mean game-level scores. That’s simply the average of his game-level Grid WAR scores—or equivalently his season aggregate divided by starts. It characterizes a pitcher’s average effectiveness per start as opposed to his aggregate contribution to team wins over a season.
Consider first this regression analysis.
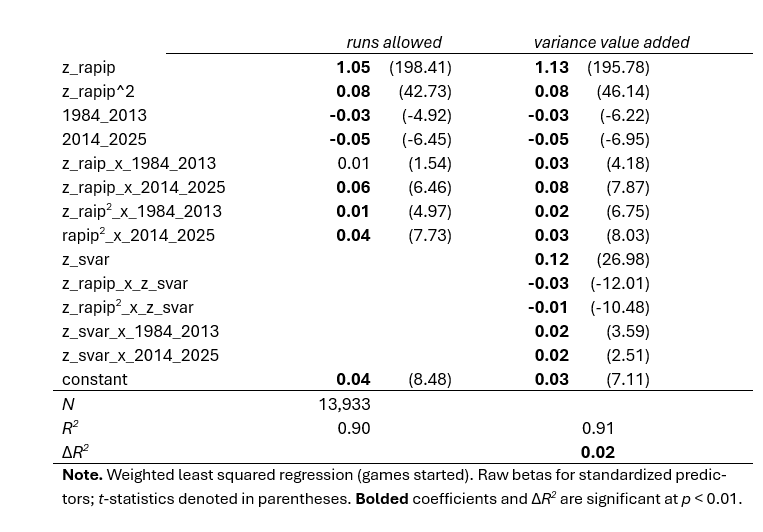 The first step regresses Grid WAR scores of starters from 1952 (the first season for which B&W supply Grid WAR data) to 2025 on runs allowed per inning (RAIP). The RAIP2 term is included because the relationship between Grid WAR and runs allowed turns out to be nonlinear.
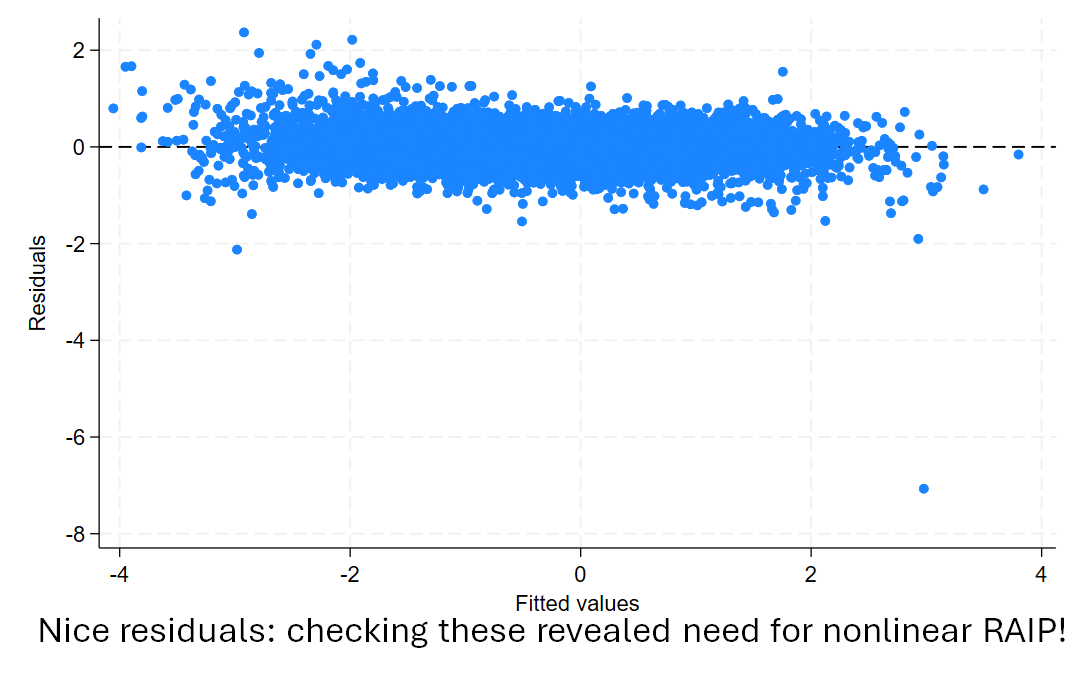
Both RAIP and Grid WAR are season standardized, a transformation that puts the effects of each on a common scale across varying “run environments,” i.e., seasons that differ in their overall levels of run scoring. But to take account of the evolving contribution of starting pitching to team records
over time, the model also includes explanatory variables for starter-usage eras and for their interactions with runs allowed.
What we see is that by itself this specification of the relationship between Grid WAR and runs allowed per inning accounts for 90% of the variance in pitcher Grid WAR scores. In other words, Grid WAR is very predominantly a reflection of how good pitchers are at suppressing runs—just like eFIP.
The second step in the regression model adds explanatory variables to account for starter variance. I measure starting-pitcher variance in runs allowed in a manner akin to how an actuary would measure variance in, say, workplace accidents: just as she would look at the difference in how many accidents occur in a week or month and the number expected to occur over that period, I consider the difference in the number of runs a pitcher allows each start and the number one would expect him to allow given his rate of runs allowed per inning. (For a full explication, see my paper “Against Pythagorean Benchmarking.”)
The addition of these variables increases overall variance explained to 0.915. That is, on top of the 90% explained by simple run suppression, starter variance explains an additional 1.5% of the differences in starter Grid WAR scores.
Like runs allowed and Grid WAR, the starter variance measure—z_var—is standardized to remove the influence of shifting run environments. The model also includes terms for the interaction of z_var with RAIP and with the starter-usage variables—to assess how the impact of starter variance might have changed as teams have come to make greater and more varied use of relief pitchers.
That’s something. But it isn’t much.
Indeed, I think it is pretty easy to demonstrate that it isn’t nearly enough to matter for purposes of practical assessment.
One way to get at this is to estimate the signal to noise ratio of starter variance as a component of Grid WAR. Like any estimator, Grid WAR is subject to a level of irreducible statistical noise. If that level of noise exceeds the estimated contribution of variance to Grid WAR scores, then it will be impossible to disentangle the latter from the former in any individual pitcher’s case.
That is definitely true here. On average, the estimated effect of starter variance is only one seventh the size of the standard error of individual pitcher’s Grid WAR score—even among pitchers with ≥ 25 starts.
 We can also simply assess the probability of detection directly. At a conventional significance level of p < 0.05, the impact of pitcher variance on Grid WAR scores was nondetectable in 99.9% of starting pitchers in the post-1951 sample, including ones who started at least 25 games.
Finally and in my mind most informatively, we can use Bayesian analysis to assess the consequence of starter variance for pitcher Grid WAR scores. Putting the fairly mindless “p < 0.05” threshold aside, how should what evidence we can extract about the impact of starter variance influence our posterior assessment that Grid WAR scores are responsive to starter variance?
For this purpose, we will use a “ROPE” or region of practical significance test. In this approach, we select an impact size that we are willing to treat as worthy of assigning practical importance to. The regression model estimate of such impact is then used to revise an uninformed prior and form a posterior estimate of the probability that the effect falls within the selected region.
Let’s pick a region of variance effect Grid WAR > |0.033|, which would be the equivalent of 1 extra team win or loss per 30 starts.
Recall, too, that we have formed estimates of the impact of variance over three starter-usage eras: 1952-1983; 1984-2013; 2014-2025.
We also considered how variance contributes to Grid WAR scores conditional on pitchers’ runs-allowed rate. It is clear from the model that as a pitcher allows fewer runs per inning, high variance contributes less to the improvement in his Grid WAR score (a finding consistent with installment one in this series).
But what we’ll do is for every starter-usage period use Bayesian analysis to form our posterior assessment that moving from the 50th percentile in starter variance to the 95th percentile increases a pitcher’s marginal contribution to team wins by .033 or 3.3% per game.
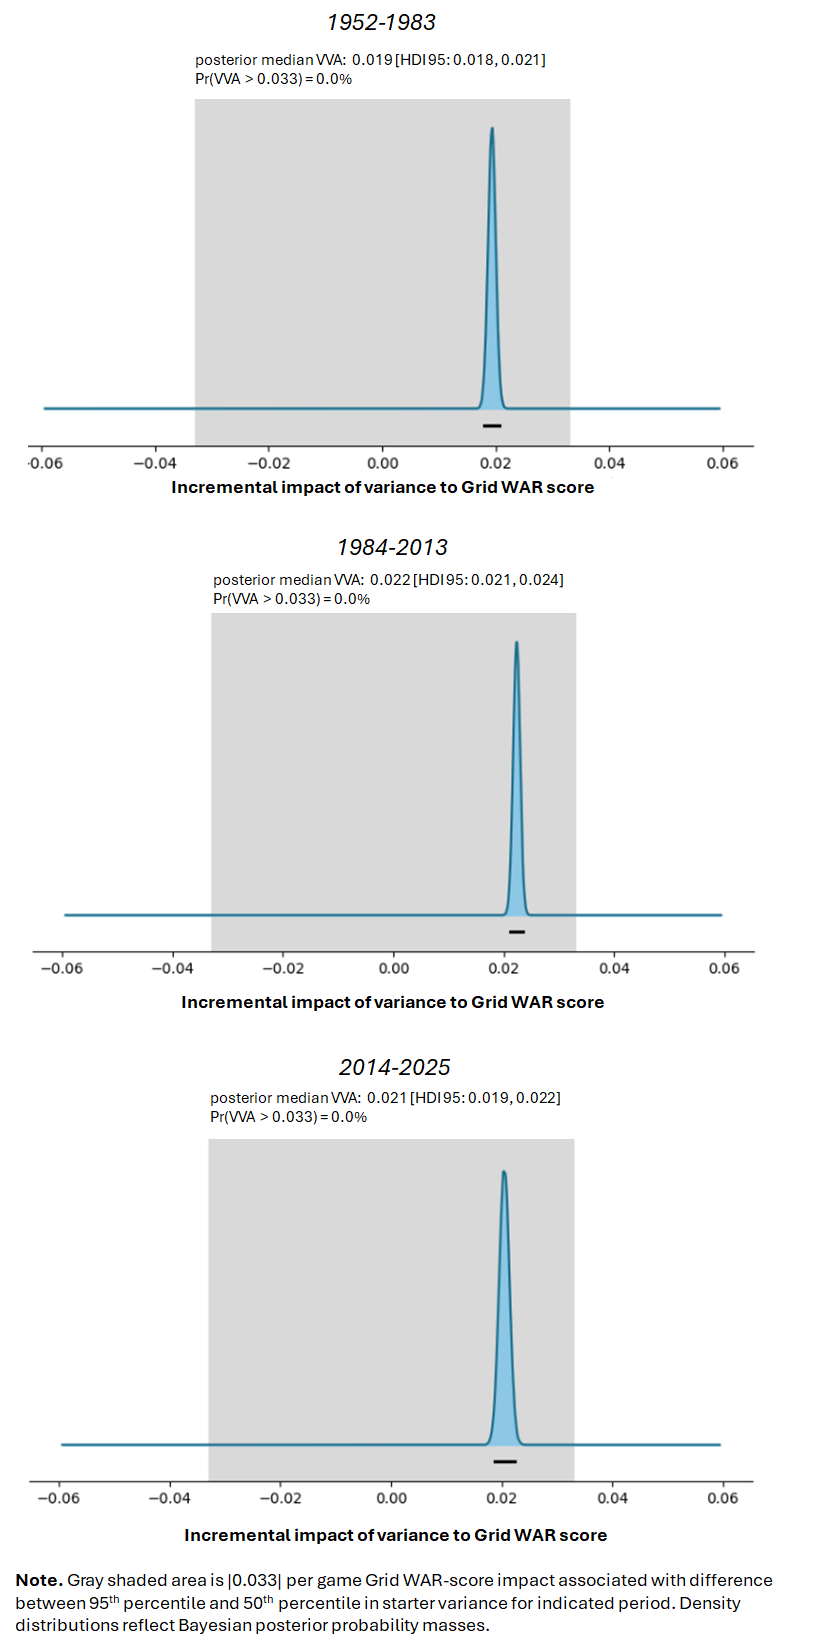
As can be seen, our posterior for every period is 0%.
We can also do a ROPE analysis for individual pitchers. That is, we use the pitcher’s own starting variance in a particular season to form a posterior assessment of the probability that the pitcher’s variance increased his Grid WAR score by 0.033—or a 3.3% marginal probability of winning per game.
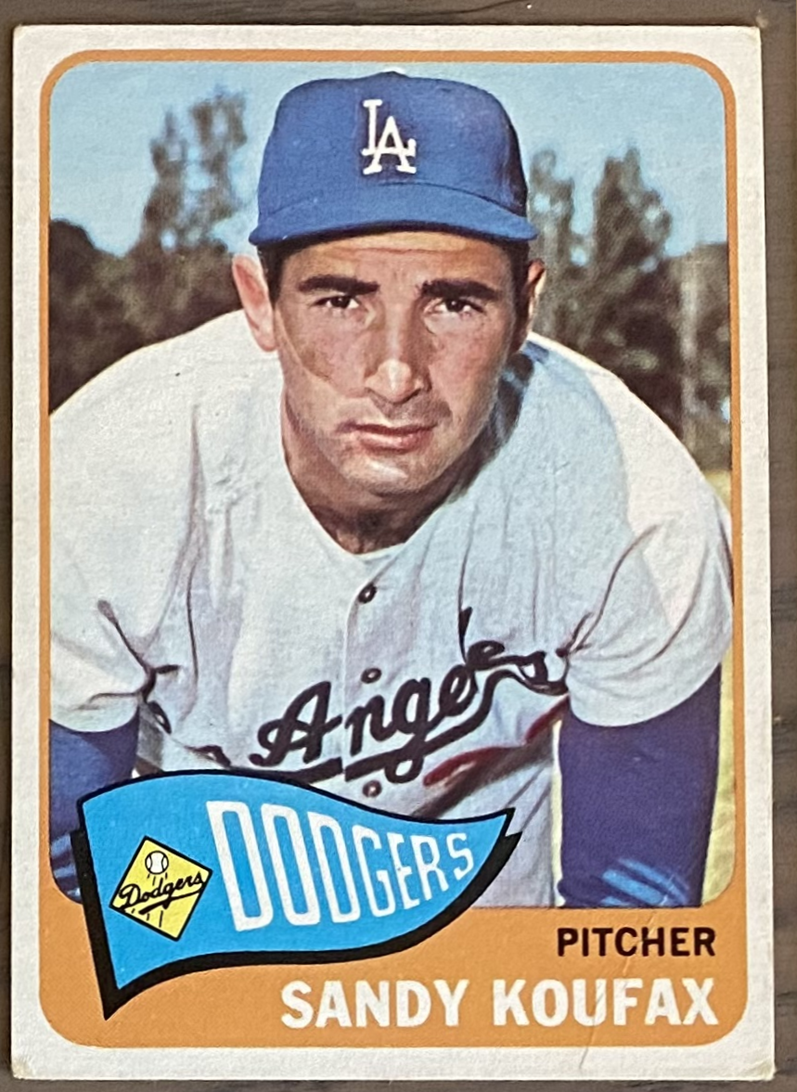
B&W single out Sandy Koufax’s 1966 campaign to exemplify the sensitivity of Grid WAR to pitcher variance. Their evidence for this is the difference between Koufax’s season scores under Grid WAR, 11.5, and FanGraphs WAR, 9.1. Because Koufax started 41 games that season, his variance contribution would have to be about 0.059 (5.9% incremental increase in win probability) per start in order for the difference to be attributable to Grid WAR’s variance sensitivity.
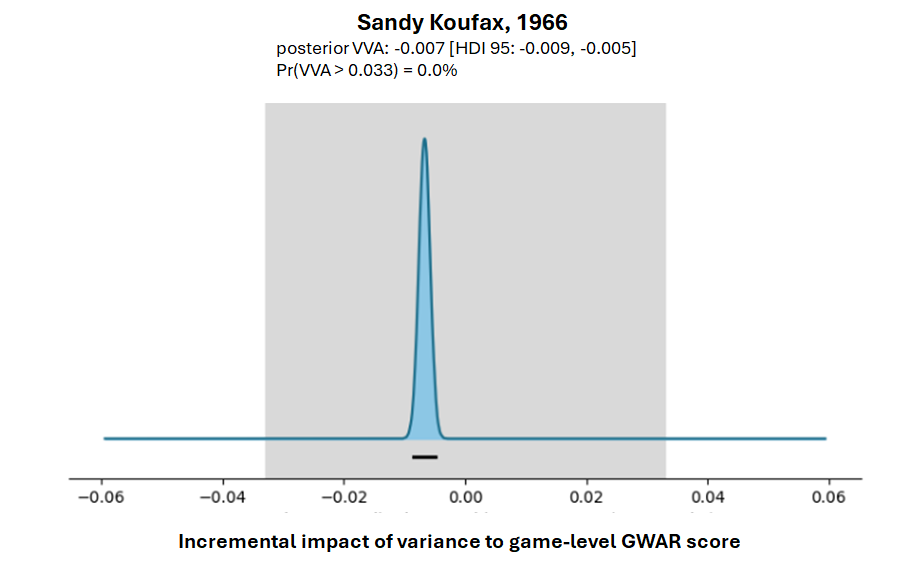
But our Bayesian posterior is 0% for Koufax’s variance having contributed even 0.033 to the Dodgers’ probability of winning in each game he started in 1966.
Koufax’s 1966 Grid WAR is substantially higher than his 1966 FanGraphs’ WAR. But the reason has nothing to do with Grid WAR’s sensitivity to runs-allowed variance; it has to do, necessarily, with that metric’s greater sensitivity to run prevention.
Bottom like: yes, variance matters, but it matters far far too little to be of consequence for any practical assessment of starter value. Variance sensitivity is not a reason to prefer a metric of starter value like Grid WAR over a metric that focuses on simple run suppression—although Grid WAR’s own exquisite sensitivity to run suppression might in fact make it better than many other measures, including Fangraphs’ pitcher WAR.
There—I think I’ve now gotten this out of my system! Time to write a paper. . . .