
 We’ve been examining the empirical—that is, actual data-supported—performance of park factors across a series of posts (here, here, here, & here).
The motivating impetus has been to evaluate “the great park factor tradeoff.” Park factors enable a form of “context-free” evaluation of performances—one that seeks to extract batter “skill” from the influence of differently configured fields, an impact omitted from raw performance metrics. That’s useful for a variety of practical purposes, like predicting player performance across hitting environments.
But it comes at a cost. Park-factor-adjusted metrics necessarily flatten out variance in performances—suppressing superior performances in “hitter-friendly” parks and puffing them in “hitter-unfriendly” ones. That effect attenuates data-driven explanations and predictions that are fueled by actual performances.
That cost can be quite high. It can be worth incurring only if park factors deliver “skill-appraisal” value high enough to offset that impact. Whether they can will depend significantly on how accurate park factors are, since obviously ones that are not accurate can’t possibly deliver a “skill appraisal” value of any real worth.
So far, the various tests performed on Statcast, FanGraphs, and Baseball Reference park factors suggest they all suffer from a pronounced bias: they all overestimate the impact of park differences on performance.
I don’t think I have done enough yet to say whether the value they deliver is too small to overcome the cost they impose on analytics driven by actual player performance. For one thing, maybe the bias can be removed.
But I am at the point where I feel quite confident in asserting that one method for using park factors to adjust performances is devoid of value and in fact results in needless disfigurement of data-driven performance analyses.
That is the so-called “additive” method, which is used by FanGraphs and Baseball Reference to compute the offensive component of position player WAR.
I’ve discussed this distinction in more detail before.
But the nerve of the additive method is that it treats the impact on one or another aspect of performance (more or fewer home runs, greater or lesser aggregation of OPS points, etc.) as “residing” in individual parks. It then attempts to remedy this effect by dolling out or subtracting those discrete units of performance in a pro-rata manner based on player opportunities to accumulate them. It results in a uniform discount or subsidy factor and can generate amusing anomalies like players having negative numbers of home runs in a season—unless an additional, ad hoc and arbitrary corrective is made.
It’s wrong, demonstrably, from a mathematical standpoint. By quantifying the relative incidence of performances in parks relative to a “neutral” or average baseline, park factors create a continuum of ratios of performance: a 110 pf park is 1.1 times as conducive to homeruns, wOBA, OPS or whatever, as a 100 pf park, and 11:9 more conducive than a 90 pf one. To figure out the impact of pf’s then, use the ratios: a hitter who plays in a 110 pf park would be expected to hit 9/11 as many in a 90 park and so on. This is the “multiplicative” approach and, unlike the additive, recognizes that the impact of park factors generate performance effects that are larger in absolute terms on better than on weaker performers.
One quick, concrete illustration.
 Batters who bat in a 110 pf park will all get a 10% boost in wOBA (or wOBA-derived “runs produced” per PA) relative to the neutral reframe park, which has a factor of 100. If the league average wOBA is .320, that “park” is treated, under the “additive” approach, as adding 32 wOBA points (and the proportional equivalent of 32 wOBA points on the “runs produced above average” metric being derived from wOBA for WAR purpose). So under the additive approach, a .360 wOBA hitter is treated as generating the output of a .328 wOBA hitter, a .300 one the output of a .268 one, a .260 a .228 one, etc.
But under the “multiplicative” approach, the impact of the 11:10 difference between the parks is seen as being not “in” a park but on a batter. A .360 wOBA is thus adjusted to .327 (.360 x 11/10), a .300 one as a .272 (.300 x 11/10), a .260 one as .236 one (.260 x 10/10), etc. The absolute impact is not just different but bigger for better hitters because ratios (which reflect percent impacts) have bigger impacts on bigger numbers. This is how park factors will work if valid.
Not surprisingly, when one tests the empirical accuracy of park factors, the “additive” approach is less accurate than the multiplicative. Indeed, the additive method generates results that are manifestly further from the observed performance impact of diverse parks than does ignoring park differences altogether. They are worse than no park-factor adjustment at all.
So the cost of them on performance-driven analytics can’t possibly be worth it!
What’s more, the costs they impose on the performance-driven assessments are much, much higher than those associated with multiplicative park factors.
In a previous post, I documented that the big explanatory deficit of FanGraphs’ offensive WAR measures relative to the wOBA-based run production base on which they sit is due almost entirely to park factors.
On the basis of the research I’ve done since then, I can now calculate how much bigger that effect is when the FG park factors are applied “additively” rather than “multiplicatively.” The difference is staggering.
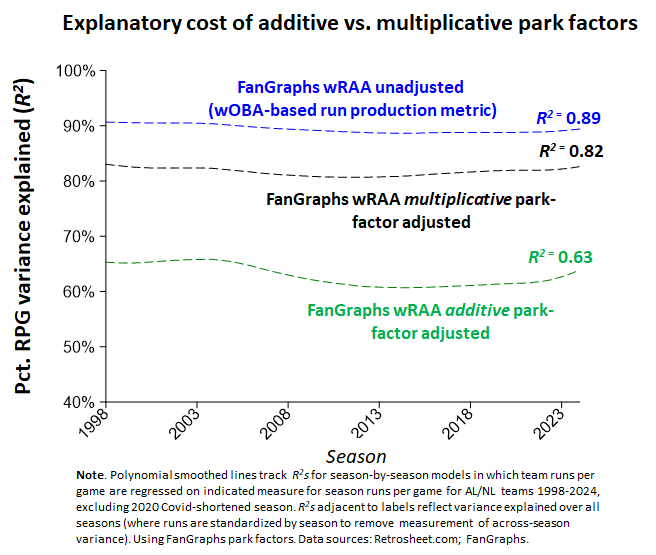
wRAA, a wOBA-based “runs produced above average” for individual hitters, explains nearly 90% of the variance in runs scored for the teams they play for.
When that same run-production score is adjusted by park factors “additively,” the fraction of variance explained in team runs scored drops to just 63%—ouch!
Adjusted for park effects “multiplicatively,” and the resulting measure is back up to a little over 80% variance explained for team runs scored. That’s a hit relative to 90%, but it’s much smaller than the one associated with the “additive” adjustment.
 The impact will certainly be comparable for Baseball Reference, which also uses the “additive” approach rather than the “multiplicative” one for computing the offensive contribution to WAR. But because Baseball Reference applies its park-factor adjustment to an alternative to wOBA—rOBA—that itself is demonstrably inferior in explaining variance in team runs scored, it’s not really worth going through the same exercise with it.
Now remember: as I said, the “additive” adjustment is worthless. Worse than worthless, in fact, because it results in park-specific effects that are less accurate than just assuming parks have no effects.
Do multiplicatively derived park factors do better than that? Well, as I indicated, I’m still puzzling that out, but they definitely don’t miss the mark by nearly as much as additive factors!
Put all this together and the conclusion is obvious: ditch the additive approach to adjusting offensive metrics for park effects! Use the multiplicative method instead.
Multiplicative is better (at least in the sense of not being nearly as bad) in extracting actual hitter “skill” from the vicissitudes of diverse-park play. And it doesn’t impose nearly so big a cost on the demonstrable value of using performance-based analytics to explain and forecast batter performance.
So there you go: an immediate, cost-free way to make FanGraphs and Baseball Reference WAR calculations instantly more accurate and valuable!