
 I live to service the curiosity of you, my loyal blog followers. And your verdict is clear and resounding: more empirical park factor data, please!
Very well, then.
So far we’ve looked at whether the home-park wOBAs of players who switch teams rise or fall in a manner that reflects the respective park factors of their old and new home fields. Nope.
Also at whether park factors derived from a series of previous seasons genuinely predict out-of-sample—i.e., next-season—differences between home-park and away-park wOBAs. Yes, but poorly: It turns out that they grossly overstate the influence of the difference between the performance of players at home and on the road in relation to the degree to which their home-park park factors differ from the park factors of the away venues in which they play.
Now we’ll look at a set of quasi-experimental analyses using propensity-score matching.
In a genuine experiment, subjects are randomly selected into two groups, one of which is assigned to some “treatment”—a medical procedure, an educational technique, or whathaveyou. Then we see if members of the groups vary in some outcome that the treatment was expected (or hypothesized) to influence—health, math proficiency, etc.
Propensity matching studies simulate an experiment that never took place.
Researchers take two groups, one which but not the other was exposed, but not deliberately assigned, to some influence of interest—a simulated “treatment”—over which they had no control. They then match each member of one group with a member of the other based on potentially important characteristics (sex, age, socio-economic status, prior health condition, educational background or whathaveyou); the idea is to populate the influence-exposed and -unexposed groups with members who are as similar to one another as they’d be if drawn at random from the relevant population.
The researchers then compare how the two groups vary in some manner—the simulated “outcome”—that one might have hypothesized would be affected by the simulated treatment.
 This quasi-experimental, propensity-matching method has been used widely to study medical treatments, educational practices, government policies, alien abduction experiences and the like.
So I did a quasi-experimental, propensity-matching analysis to test the influence of park factors on batters’ wOBAs. Indeed, I performed three such analyses using the respective park factors of Statcast, Baseball Reference, and FanGraphs.
BTW, as in previous data analyses, I used wOBA because in computing WAR, wOBA is the metric both FanGraphs and Baseball Reference use to determine hitters’ contribution to team runs. Both adjust wOBA scores based on hitter home-field park factors when they do so. Statcast doesn’t compute WAR, but does issue park factors specifically crafted for wOBA.
So . . . I assembled my matched pairs from a sample that included all hitters who played in the MLB between 1998 and 2024.
The core matching characteristic was home-park wOBA: each player in the study gets paired with another one who had a comparable wOBA at home.
The “treatment” was home field park factor: one member of each pair played for a team whose home park was in the top quintile of MLB park factors and the other the bottom quintile—i.e., parks in the top and bottom 20% for hitter friendliness, respectively.
Since everybody starts at the same wOBA baseline, we can observe whether batters who play in the hitter-friendly home parks suffered the drop in road wOBAs, and those who play in the hitter-unfriendly ones the boost, that park factors are supposed to forecast.
To make this as clean a comparison as possible, I also matched on various other characteristic in addition to home-park wOBA. These included the players’ number of home and road plate appearances. Players had to have at least 200 of each. But because I included in my pool of potential matches hitters who had played multiple seasons in particular home parks, many pairs of players had many more plate appearances than that.
I also matched on the comparability of away-field park factors. Obviously, to be valid, the test requires players from hitter-friendly and –unfriendly home parks compete in comparable away parks.
Finally, I also matched on age.
Here’s a look at the comparability of the pairs who were matched.
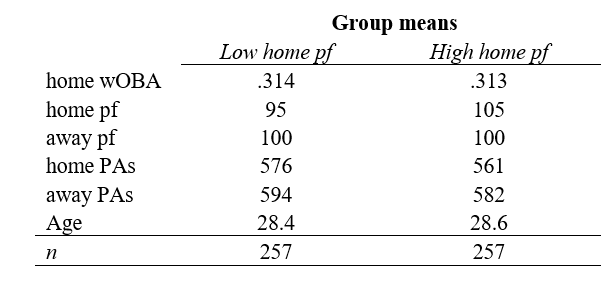 This one comes from the Statcast test, but the others were not materially different. All were selected based on a technique called “closest-neighbor matching”—which as the name suggests pairs players who are most proximate to one another on a “propensity score” index calibrated to the selected matching characteristics. The matched groups also satisfied the criteria for comparability deemed essential for valid quasi-experimental studies.
I ended up with 113 matched pairs of players for BBR, 194 for FG, and 257 for SC (the most who met the group-comparability criteria for each).
All three analyses showed that park factors had an effect in the expected direction. That is, in all of them, players from the hitter-unfriendly parks out-performed their matched counterparts (on average at least) when the two played in comparable road venues.
But the size of the effect was not nearly so large as one would have predicted based on the differential between the park factors of their home stadiums and those of the away ones in which they played.
These figures summarize the results:
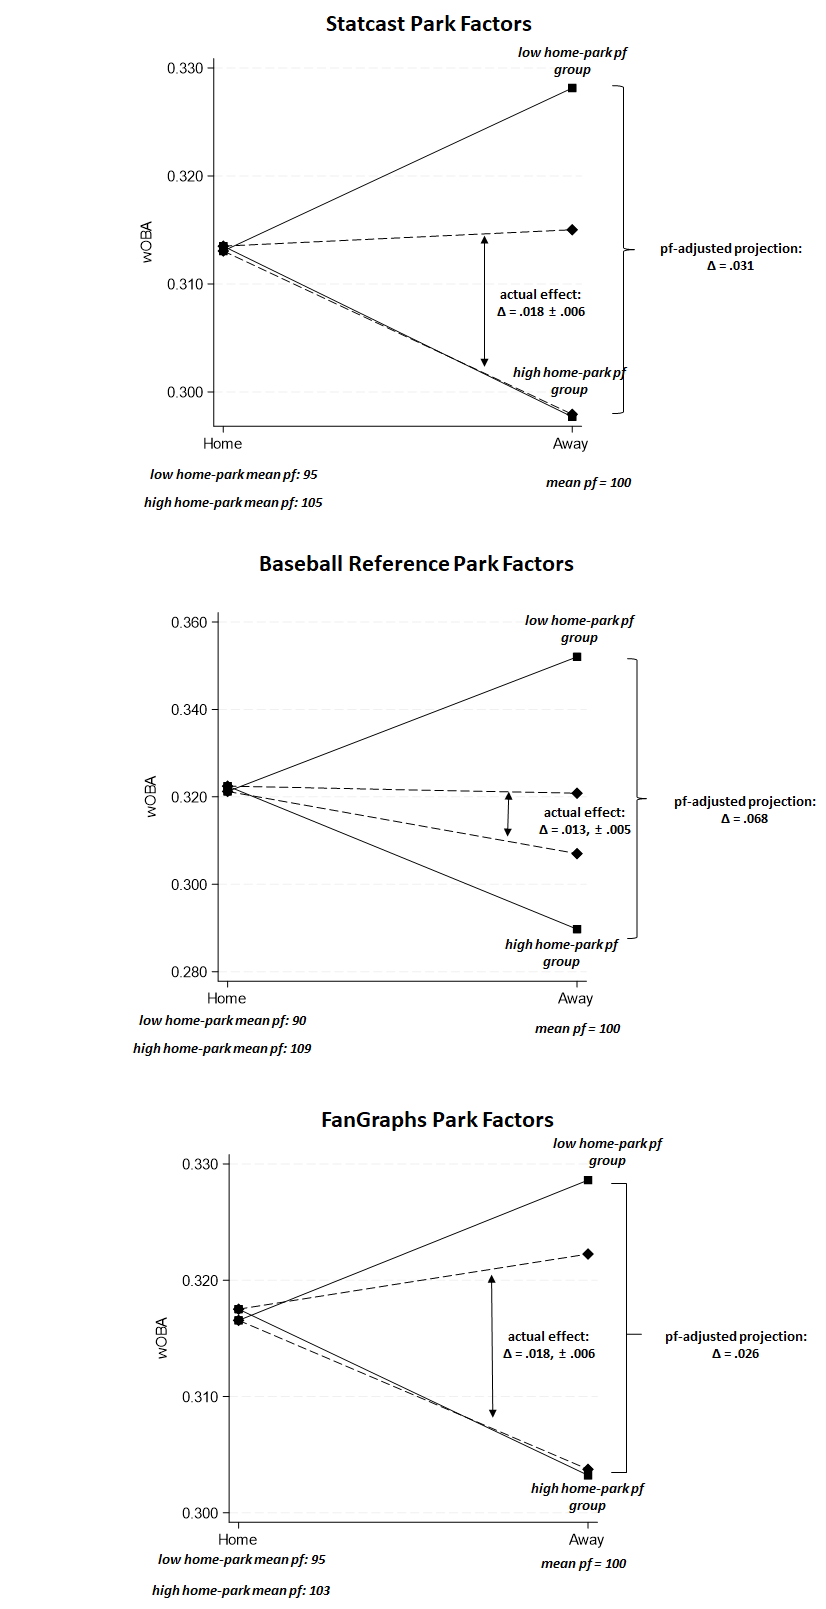
The gaps are not uniform. But neither were the differentials between the away parks and home parks. In all the analyses, visiting parks averaged 100. But as reflected in the figures, the size of the discrepancy between the hitter-friendly groups’ and the hitter-unfriendly groups’ varied to a degree.
Accordingly, I’d say the exact size of the effects tells us less here than the common result—that all the tested park factors predicted effects substantially larger than the ones observed. (The effects predicted were determined according to the conventional “multiplicative” rather than the inherently inaccurate “additive” method.)
 This result is consistent with the out-of-sample results I featured in the last post. It’s starting to look like effect overestimation is a settled feature of all the leading park factor sets. Whether the overestimation is large enough to counteract their value—the motivating question for this series of empirical examinations—is yet to be addressed (stay tuned).
You’ll notice, of course, one curious thing. For all of these tests the overestimation effect was concentrated in the performance of batters who play in hitter-unfriendly parks: indeed, in in relation to the BBR and SC factors, those batters didn’t see any real improvement on the road. Those who played in hitter-friendly ones did suffer the expected amount on the road predicted by the SC and FG park factors—although not by the amount predicted by BBR. . . .
What to make of this?
I really don’t know. I’m trying to think of reasons why this would happen that would admit of additional testing.
If you can think of any, please let me know!
(Oh, if you are wondering if the answer could have something to do with a “home-field advantage” that drives down away performances relative to home ones regardless of park factors — that’s a really good conjecture! But it isn’t in fact the source of this effect: the “home-field advantage” shows up as a constant in the regression model used to assess the size of the impact of road play on members of the two groups; it is thus effectively “removed” before the road-play effect on the wOBAs of players from high-pf home parks and from low-pf ones, respectively, is tallied!)
But for now, I’m signing off—I need to get back to my computer before the data-withdrawal symptom become unbearable!