
So here’s another postcard(!) from “down under”—i.e., deep inside the park factor rabbit hole!
Things look pretty cool down here. Consider:
So what is this strange creature?!
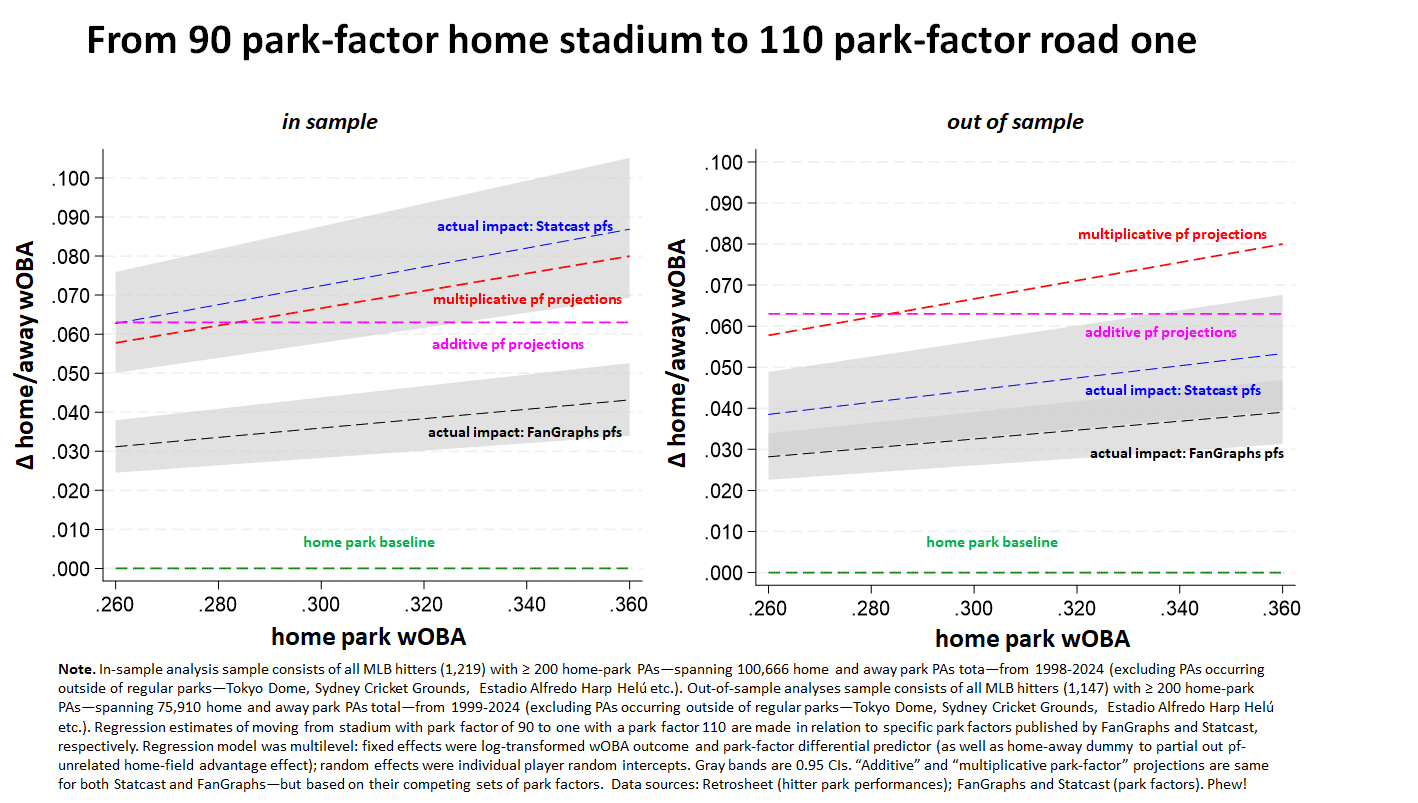
It’s a pair of comparisons of theory-driven park-factor estimated wOBA impacts with empirical regression-model estimated ones. The featured park factors come from Statcast and Fangraphs, respectively. The analyses in the left-hand panel are “in sample”—that is, based on park factors derived from the very seasons in which park-specific wOBAs were observed. The second set is “out of sample”: that is, based on predicted effects for park factors issued before the start of the season in which the impacts were observed.
The estimates reflect impacts of moving from a relatively hitter-unfriendly stadium (park factor = 90) to a hitter-neutral one (= 100) .
Let’s start with details of the data analysis, and then move to inferences.
1. Park factor estimates
This is easy! Or maybe not. . . .
Calibrated to one or another aspect of performance, park factors reflect the degree to which that performance varies in that park relative to a “neutral” one.
That’s how factors are derived (usually with data comparing performances in a team’s home park to performances in its away ones, subject to some theoretically sensible tweaks).
And it’s often how they are applied (see how the Michael Schell, in his masterful works, uses this to derive historically adjusted batting averages, doubles, triples, homeruns, etc.). So if a player with a .300 wOBA moved from a hitter-unfriendly 90-pf park to an –friendly 11-pf, we multiply .300 by 11 and divide by 9, and get a .367 expected away park wOBA.
That’s called the “multiplicative” method of park-factor adjustment.
The other approach is the “additive” method. Under it, one determines how many “more” or “less” of something (say, home runs) happen per some event (say, an at bat) relative to a neutral park. Then one “adds” to the player’s performance tally the number of additional units of performance corresponding to his share of the “events” (ABs in the case of home runs) that happened in that park.
 E.g., say a team hit 110 home runs in 2500 at bats in its 100-pf home park and 100 in 2500 on the road. We’d conclude that the team’s park had an “extra” 10 home-park four-baggers. If a player had 10 HRs in 250 ABs, his park-adjusted total would be 9: that is, 10 + 110/10 x 10 x 250/2500. . . . Let’s see—I guess if he had zero, he’d get minus 1. . . .
But in any case, the graphs plot the projections of each method across the continuous range of wOBAs from .260 to .360. The calculation assumes moving from a home park with a 90 pf to a visiting one with a 110 pf, but it generalizes—plug in whatever numbers you like, use the ratios for the relevant factors, and you’ll get the correct park-adjusted estimate.
2. In sample vs out of sample plus regression model estimates
Now what about the regression-model estimates? Here’s what’s going on with those.
Those estimate reflect the actual effect of moving from 90-pf home park to a 110 away one.
They make those estimates in the way regressions normally do—namely, by identifying the best relationship between the observed data—here, home vs. away wOBAs—and specified predictors—for our purposes, the home and away stadium park factors (plus a dummy variable for playing on the road, designed to remove a generic “home field advantage” unrelated to park factor effects).
The regression models do this for both SC and FG; and they do it twice for each. The first time, represented in the left panel, is “in sample.” That is, the seasons used to observe players’ home and away performances (ones compiled by 1,219 hitters who came to bat over 100,000 times across various parks between 1998-2024 during which they had at least 200 home PAs) are the very same ones used to compute park factors.
3. So what are we seeing here?
Unless the park factors are defectively computed, the in-sample regression estimate and the multiplicative park-factor estimate should be essentially the same. The park factors are mathematically back out of the difference between home park and away park performances. So we should expect those performances, when actually analyzed in relation to the parks in which they occurred, to reproduce the relationship reflected in the park factors.
They do, essentially, for Statcast. Good!
But they don’t for FanGraphs. . . . Because the plotted regression line for the actual impact of differences in park factors on home and away performances is situated far below the red-dashed line, FanGraphs park factors can be inferred by a defective method.
In fact, Statcast and FanGraphs do use different approaches for calculating park factors. FG uses a traditional team home-away run differential method (with various important tweaks). SC, in contrast, uses an event frequency approach. That is, SC compares the rate at which events of interest—wOBA components, in this case—occur at different parks, regardless of which team hitters play for. One would SC’s factors to be more precise because it is using a lot more information—not just team level performances home and away, but player performances everywhere. The in-sample analysis, then, suggests that the relative imprecision of FG’s method relative to SG’s is so great that it really doesn’t make a lot of sense to use the former instead of the latter.
But the near-perfect fit of a properly calibrated set of park factors when measured in-sample—that is, in relation to the various park-specific performances used to derive the park factors—doesn’t mean the park factors are perfectly accurate!
No matter how similar they are to one another, there will always be differences between performances in different parks due purely to chance. Park factors derived from what is actually observed in parks don’t distinguish between differences due to chance and differences genuinely attributable to variation in the park’s hitting environments. If you apply park factors in-sample, then, you risk adjusting player’s performance based on statistical noise.
That’s the problem the out-of-sample analysis assesses. That analysis here is based on 1,147 players with 200 or more home-park season ABs who compiled over 75,00 park-specific plate appearances between 1999 and 2024, It uses one season’s park factor (which itself is based on a rolling average of previous seasons, to try to reduce the influence of noise on the pf calculation) to predict the next season’s performance (which is necessarily “out of” the sample of seasons from which that park factor was derived). If the park factor is being computed in a way that excludes undue influence of chance differences, then the actual results associated with this lagged park factor also ought to match up closely with the theoretical projected park-factor approach.
 But as the second panel shows, they don’t match up all that well. Both Statcast and FanGraph’s park factors are substantially overestimating (falling far short of) their respective projections as reflected in the red dashed line. That’s actually worse than noise; it’s systemic bias.
BTW, you might conclude from the right-hand panel that the “additive approach” is more accurate. It’s true that it doesn’t overestimate by as much here. But that is an artifact of the differences of the approaches generally; the additive approach will always generate uniform estimates that are insensitive to differences in player performance. But if park factors worked exactly as advertised, then the “multiplicative” approach would always be more accurate; you can see that in the in-sample analysis, where a multiplicative approach crushes the additive one in relation to the fit between Statcast pfs and actual performances). The reason for this is that the multiplicative approach is sensitive to how park-factor ratios imply larger absolute impacts as performances improve (and thus wouldn’t generate the silly result that a player who hit 0 HRs should have his total “adjusted” to -1 in my example above). It’s only when park factors don’t work as advertised—because they either are calculated incorrectly or being fitted too sensitively to noise or random variation—that a defective “additive” alternative might happen to do less harm.
4. None of this is to say, however, that there is no park-effect impact on hitter performances!
There clearly is! At the friendly 110-pf away park, the wOBAs of batters who play in hitter-unfriendly pf-90 home ones jump between 39 to 53 points under the methodology Statcast employs, and 28 to 39 under the one used by FanGraphs. So it’s not that park differences don’t matter—they just don’t matter as much as either of these sets of park factors would predict.
5. How important is the park-factor overestimation observed here?
I don’t think I’ve given you enough information to answer that critical question—at least not yet!
 As discussed previously, park factors are important for a host of practical and theoretical inferences about the comparability of player “abilities” as distinct from the real-world value generated by “raw” player performances. But the value of park factors for that will depend on how predictively accurate park factors are; if their accuracy suffers by too high a degree (either because they are defectively formulated or are over-fitted to chance differences unrelated to genuine run-environment ones), they will generate “ability” estimates that are worse than the ones one would get if one used raw player performances without any adjustments.
Are the park-factor overestimates high enough to vitiate their value in this way? I dunno! I’d have to think more about that. Think more, too, about how to specify “raw” for predictive purposes (that’s not as straightforward as you might imagine). And finally, about whether there might still be a way to calculate park factors that overestimates less than either FanGraphs’ or Statcast’s do.
For all these reasons, I’m not done yet in my report from down here in the rabbit hole!
Indeed, I’ve done some other analyses that help shed light on—and variously amplify and qualify—the conclusions from this one.
More anon!