
 I’m returning to pitcher estimators, and in reviewing FanGraphs’ WAR calculation discovered a truly cringeworthy glitch.
FanGraphs uses a variant of FIP—fielding independent pitching—to determine the pitching “runs saved above average” total it feeds into its WAR calculation. I actually agree that FIP is the right starting point, although I think it is obviously wrong to use the conventional, season-invariant fixed weights for FIP events—strikeouts, walks, home allowed, and hit batters.
But that’s not the issue here.
Nor is the problem the tweak that FanGraphs adds for infield fly outs, which it treats as equivalent to strikeouts for computing FIP.
The difficulty resides in the “constant” that FIP adds to make FIP “look like” ERA.
The details of how the constant is computed aren’t important. What needs to be understood is that the constant is just a quantity added to the raw FIP to make it appear like a number that resembles what people expect an ERA to be.
After it plugs in this ERA-mimicking constant, FanGraphs uses its FIP-specific park factors, applied multiplicatively, to adjust its constant-adjusted FIP.
This is a mathematical car wreck!
Again, the constant is just a uniform sum arbitrarily added to FanGraphs’ FIP variant for aesthetic purposes. It has no relationship to differences in pitcher performances or the impact of their home park on their pitching outcomes.
But because this constant is included in the FIP variant that FanGraphs modifies with park factors, the contribution that the constant makes to determining a pitcher’s runs saved also grows or shrinks based on pitchers’ home parks.
This is demonstrably incorrect and biases the FIP-derived performance metric that Fangraphs subsequently feeds into its pitcher WAR measure.
Let’s look at a simple example to illustrate.

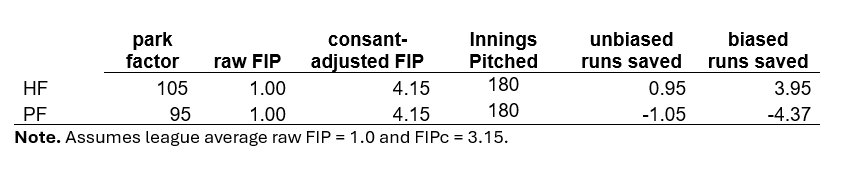
Suppose two pitchers, PF and HF, with equal raw FanGraphs FIPs of 1.0 (which technically reflects the estimated marginal run impact of the pitchers’ FIP-event rates relative to 9 innings of uniform ball-in-play outcomes). PF plays in a pitcher friendly park with a park factor of 95, and HF plays in a hitter-friendly stadium with a factor of 105.
Let’s assume, too, that the average raw FIP for a neutral park pitcher is 1.0.
And for convenience, let’s assume that both PF and HF pitched 180 innings—the equivalent of 20 full games.
Under these circumstances, HF’s “runs saved above average” is 0.95 (20-20x[100/105]), and PF’s -1.05 (20-20x[100/95]). It makes sense that despite their raw FIPs being the same, HF is responsible for adding 2 fewer runs to his team’s total, since he played in an environment much friendlier to hitters.
It also makes sense that their respective “runs saved” average 0, since they in fact had league-average FIPs and played in parks that differed from a neutral one by symmetrical amounts.
Okay. Now let’s consider what happens when we do things the FanGraphs way.
FanGraphs’ ERA-mimicking constant, let’s assume, is 3.15 (pretty typical). Thus, both HF and PF have constant-adjusted FIPs of 4.15, which is also the constant-adjusted league average for a neutral park.
Now consider how “runs saved” per 9IP comes out: for HF, it’s 3.95 (83- 83x[100/105]); for PF, it’s -4.37 (83-83x[100/95]).
In other words, we are now to believe that HF saved his team 8.32 more runs than PF!
Bottom line: applying the park factor to the ERA-constant modified FIP generates a 6.32 run bias in the estimation of the difference of these two pitchers!
Note too that the two runs-saved totals no longer average out to 0–an unmistakable clue that the constant is messing up the estimated difference in the performance of these pitchers.
There are at least two ways to address this. One would be to adjust pitchers’ raw FIPs for park factors multiplicatively before adding the ERA-mimicking constant. The other would be to use park factors additively after using the constant-adjusted FIP to calculate pitchers’ “runs saved above average.”
But what FanGraphs is doing is not valid. They should fix it.