
 I’m circling back to formulating a pitcher estimator. I explored that back when I examined ball-in-play propensities. but I feel I didn’t get a very good handle on then. So forget how BIP enters into the picture for now.
The estimator I want to form is based on “fielding independent pitching”—that is, the elements of pitching performance (strikeouts, walks, home runs allowed, and hit batters) that don’t depend on fielding.
There is a conventional FIP measure. But it’s based on invariant weights that ignore the changing relative impact of fielding-independent outcomes over time and thus to suffer loss of explanator power.
I favor an empirical variant of FIP that uses season-specific weights for the fielding-independent pitching events. Let’s call this alternative, then, eFIP.
Here I’m going to (1) explain how eFIP is formed and (2) compare its value as an estimator to the pitcher-value metrics that inform both Baseball Reference’s and FanGraphs’ respective WAR calculations.
Creating an eFIP-based estimator
So eFIP, like FIP, uses fielding-independent events to measure pitcher proficiency—but like I said rather than fixed weights–the provenance of which is mysterious and the relationship of which to FIP outcomes is destined to become progressively more arbitrary— eFIP uses season-specific weights.
Here is the basic derivation (a more formal explication of which can be found in the paper Against Pythagorean Benchmarking):
- Calculate the “pitching runs allowed” for every team in AL/NL history. “Pitching runs allowed” is the nominal number of runs a team’s pitchers are responsible for independent of the proficiency of the team’s fielders. It is formed, then, by adding to the team’s total runs allowed the number of runs saved due to team fielding (a sum that is based on a composite of fielding runs-saved measures that can be independently show to have the greatest empirical power). This sum, then, can be either larger or smaller than the team’s actual runs allowed depending on whether the team’s fielders averted runs via their skillfulness or cost the team runs via their ineptitude.
- Form empirical, season-specific FIP weights. This step involves simply regressing season-by-season teams’ pitching runs allowed on fielding independent events—strikeouts, walks, home runs allowed, and hit batters, all measured as rates per inning. The resulting weights then tell us how much each of those elements of pitching mattered on a season-specific basis to allowing pitching runs.
- For each season, figure out each individual pitcher’s eFIP and the league weighted mean. All we do here is apply the eFIP weights to pitchers based on their innings-pitched rates of strikeouts, walks, home runs allowed, and hit batters. The resulting eFIP is an expected pitching runs allowed per inning pitched. The weighted mean is just the average of all the pitchers’ eFIPs for a season, weighted by their innings pitched.
- Calculate every pitcher’s individual pitching runs saved. For this, we just subtract each individual pitcher’s eFIP from the season weighted mean. When his eFIP is less than the weighted mean, the difference will have a positive value, which reflects the expected number of pitching runs saved relative to the average pitcher—and remember, that’s on a per inning basis, since that is the units in which eFIP has been calculated. Obviously, if a pitcher’s eFIP is greater than the weighted mean, the difference between the latter and the former will be negative, meaning that the pitcher is saving fewer runs than the average pitcher per inning.
Let’s call this final result a pitchers eFIP_prs. It’s our per-inning runs-saved, eFIP-derived pitcher-value estimator.
One can multiply it by innings pitched to calculate a total number of expected runs saved by the pitcher—total prs. That’s a decent measure of his overall expected contribution to his team over the course of a season. But by using the rate form as the estimator, we have a measure of his skill that doesn’t vary according to his pitching volume.
BBR’s and FG’s “pitching runs saved” metrics
Both Baseball Reference and FanGraphs base their pitcher WAR calculations on their own variants of “pitcher runs saved.”
FanGraphs. FG calculates pitcher “runs [saved] above average” based on a variant of FIP, one that adds infield fly outs to strikeouts before applying the conventional, fixed FIP weights.
In addition, for aesthetic reasons, FanGraphs likes FIP to “look” like ERA. It thus adds an arbitrary constant to every pitcher’s adjusted FIP. As explained in the last post, because the effect of the constant gets magnified or shrunk when when FG applies its park-factor adjustments to this constant-modified FIP, the resulting “runs saved” measure is demonstrably biased.
Baseball Reference. Baseball Reference’s approach is decidedly atheoretical. Rather than estimating pitcher value based on observable metrics of performance, it just statistically summarizes what actually happened during his time on the mound. For every pitcher outing, it simply subtracts the number of runs a pitcher allowed from the number the opposing team would have been expected to score, given their season average runs per game, in the number of innings that pitcher faced them. Sum those up, adjust by park factors, and that’s the pitcher’s season runs saved.
Comparative estimator evaluations
An estimator, as I’m using the concept, is an inherent skill measure. It doesn’t just “sum up” a player’s observed performance impacts (like homeruns or strikeouts); instead it uses observable performance indicators to measure a latent or unobserved propensity that can be used to assess and predict how much players added to their teams’ on-the-field outcomes—either in runs scored for hitters or runs averted for pitchers and fielders.
There are two essential qualities an estimator must have. First, it must be reliable. That is, it must generate a consistent measure of the differences in player skill that it is characterizing. If the measure varies from season to season across players in a haphazard way, then the purported estimator isn’t actually measuring anything—which is a problem unless there really is no difference among player skills levels to measure (pretty unlikely).
Second, the estimator must be valid. That is, assuming it is measuring something, the thing it is measuring must actually be what it is supposed to be—here, pitcher skill differences.
The most straightforward way to validate an estimator is to show that it accurately predicts performance.
Let’s see how eFIP_prs does against FG and BBR’s pitcher-runs saved metrics in this regard. I’ll use both site’s “runs [saved] above replacement” (RAR) rather than above average, although in fact this makes no difference for our purposes (“above replacement” and “above average” are just alternative reference points and are 100% interchangeable for evaluating the relative quality of major league players).
To make the BBR and FG metrics commensurable with eFIP_prs as performance–quality measures (as opposed to a season value ones), I’ll divide every pitcher’s season RAR by the number of innings he pitched. We’ll call those measures BBR_prs and FG_prs.
Reliability
Intraclass Correlation—ICC—is arguably the best measure of reliability for a latent-trait estimator like pitching skill.
When we measure pitcher performances season by season, some fraction of the variance in our measurements will be due to genuine differences between the pitchers and others to fluctuations in each pitcher’s own performances.
ICC splits those two sources of variance apart. A high ICC indicates the existence of genuine, enduring differences in the level of the underlying trait—a low one the predominance of erratic ups and downs in measurements of individual sample members’ levels of it.
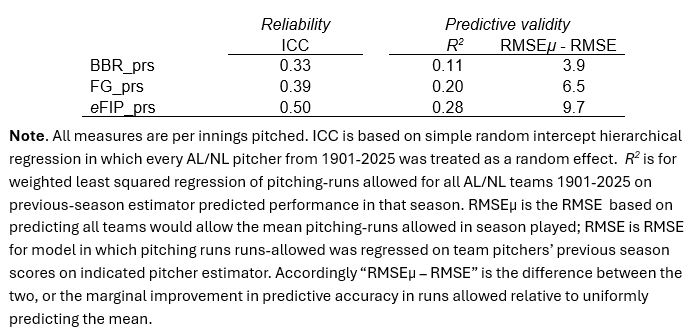
The ICC for eFIP_prs was 0.50—meaning 50% of the variance was attributable to differences among pitchers in the level of skill that prs_ip is measuring, and 50% to year-to-year differences in the performance of individuals.
How good is that? Well, it wouldn’t be great if eFIP_prs were being evaluated against the benchmark of, say, a math aptitude test, which would be expected to have an ICC ≥ 0.70.
But in relation to skill at baseball—a game with an obviously high degree of volatility in year-to-year performance due to injury, aging, and the like—it’s really good. Indeed, it is equivalent to the ICC for OPS, the utility of which as a measure of innate, stable batter skill is beyond dispute.
The ICCs for BBR_prs and FG_prs were 0.39 and 0.33, respectively. That means they substantially noisier, and less less discerning of real skill differences, than estimators that are generally used to measure hitter value.
Predictive Validity
The validity of the various measures was assessed by their predictive power.
For this purpose, the observed pitching runs saved for every team in AL/NL history since 1901 (see (1) above) was calculated.
The various estimators were used to form out-of-sample predictions of the same. First, every team pitcher’s eFIP_prs_, BBR_prs_, and FG_prs values from his previous season were multiplied by the number of innings he pitched in the current season. Then those results were summed across all a team’s pitchers. (Pitchers who were inactive the season before were treated as expect to be average in quality, an assumption that was neutral across the measures but did add some noise into the precision of the test.)
This generated for each estimator an out-of-sample predicted team season pitching runs saved total, which could be compared to the team’s observed total.
I should add, all of this was done with season-standardized measures of the pitching runs allowed, a technique that removes the impact of shifting run-environments and other skill-unrelated influences and puts on a common scale the pitching-runs saved values of pitchers across all baseball eras. For interpretability, we can convert the numbers back into run values by assigning representative values to the resulting standardized scores. I’ll use AL/NL historical mean number of pitching-runs saved per season and the historical standard deviation for the same (both weighted by team innings pitched).
The BBR_prs and FG_prs metrics explained 11% and 20% of variance in team pitching-runs allowed. That’s actually better than I expected. They are getting a piece, at least of what they are supposed to be measuring, even if they aren’t doing so very reliably.
eFIP_prs explained 28%.
The weighted mean for all AL/NL teams was about 690 pitcher-runs allowed per season; the (weighted) RMSE for eFIP 58.1, meaning that that its predictions missed the target by about that much on average. That’s about 9.7 runs better than just predicting every team will allow the average number of pitcher-runs allowed.
The BBR and FG runs-saved per inning predictors generated 6.5 and 3.9 runs gains over just guessing “average runs allowed” per team.
 I feel pretty good about eFIP_prs’s performance in this regard. In general, it’s really really hard to predict (truly predict, not retrodict by ex-post model fitting) how many runs a team will allow knowing only on the workload of its pitchers.
Obviously, if one wanted to max out on accuracy, one would use more information than just how teams’ pitchers did in the last one. But if you have an estimator that can explain 28% of the variance in team pitching-runs allowed based solely on how its pitchers did in the previous season, then likely you’ll want to use it as part of the mix of information you build on—which likely will include a skill estimate that is cognizant of more than just one past season of performance by each team’s pitchers .
The BBR and FG metrics weren’t a disaster but did perform less well, both along the reliability and validity dimensions. I’d have been pretty shocked and disappointed if an eFIP-derived estimator hadn’t beaten them, given the fairly obvious problems that they suffer from.
At this point, eFIP_prs’s reliability and predictive validity make me feel that it presents a rabbit hole I’m definitely interested in climbing down. . . .
Stay tuned!