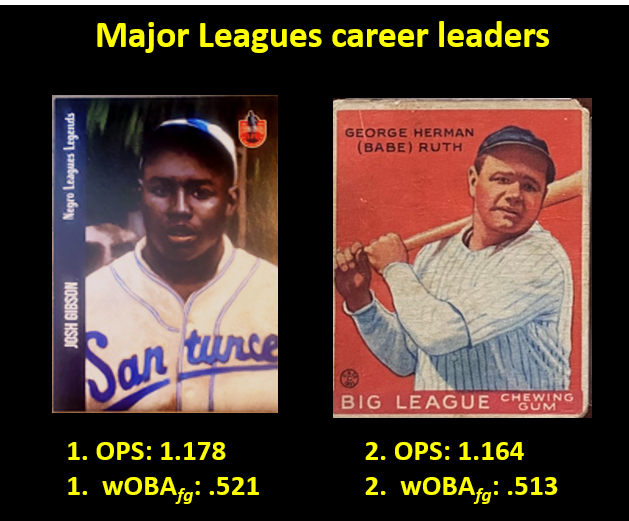
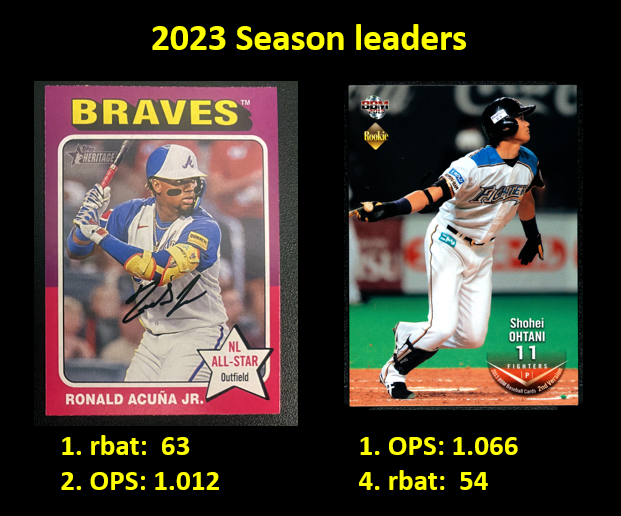
No, wOBA is not a delicious type of sushi. It is a hitting-production metric that is supposed to be better than OPS and that figures in the calculation of WAR.
 I thought this post was going to invovle some kind of hyper-theoretical explanation of why, despite being a less successful empirical predictor of runs scored, OPS has theoretical virtues that make me prefer it to wOBA.
But I don’t think there’s any need for that. Because as far as I can tell, wOBA isn’t superior to OPS as a predictive measure after all.
wOBA stands for “weighted on-base average.” It was devised in the classic work The Book: Playing the Percentages in Baseball by Tango, Lichtman, and Dolphin (TLD), who, as I said, proposed it as a superior alternative to the much more familiar OPS measure (on-base percentage plus slugging).
wOBA is calculated by adding weighted sums corresponding to the at-bat rate at which a player (a) hits a single, (b) hits a double, (c) hits a triple, (d) hits a home run, (e) is walked, and (f) is hit by a pitch. The weights attached to these outcomes reflect the individually calculated fraction of a run associated with each of these positive hitting outcomes.
TLD’s formula was:

Because the correlations between these batting outcomes and runs change every season, Fangraphs and Baseball Reference adjust their wOBA weights annually. The Fangraphs season-by-season weights are here; the measure Fangraphs derives from them is scaled to mimic on-base percentage. Baseball Reference makes a complex series of adjustments and scales its measure, called “rbat,” to reflect how many more runs a hitter contributed to his team than the average batter would have in a given season.
 TLD present an interesting argument about why wOBA is better than OPS. But before taking it up, we need to be shown that wOBA works better than OPS in measuring a hitter’s productivity.
It doesn’t. Or at least that’s what the data say to me.
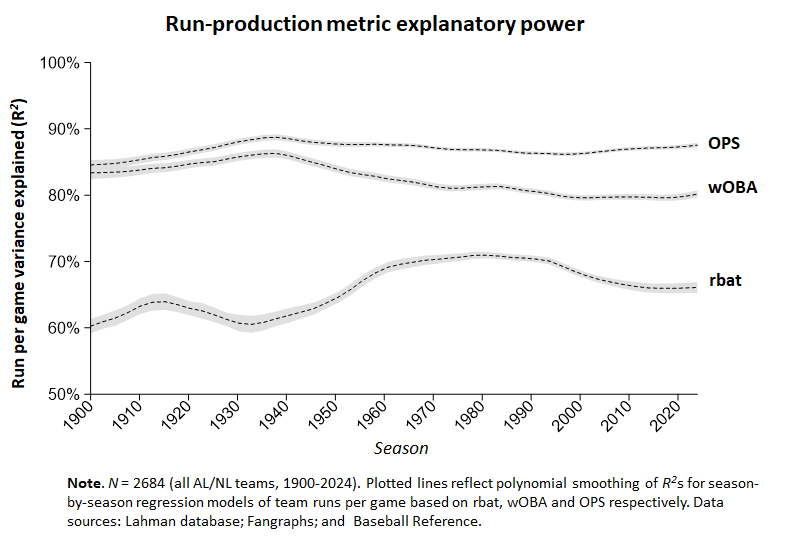
I conducted regressions that related OPS as well as Fangraphs’ and Baseball Reference’s respective variants of wOBA to runs scored for every AL and NL team for every season from 1900 to 2024.
OPS outperformed them both. Overall, OPS explained an extremely impressive 87% of the variance in team runs scored per season. wOBA explained a very respectable 82%. That might not seem like a big difference, but there’s certainly no reason to throw that additional increment of information away. The more extensively tweaked rbat explained only 65% of the variance in team runs scored.

I should add that this, like anything else I think I know, is provisional. TLD are experts who’ve been studying these matters for a long time & from whom I’ve learned a lot. If they or any other reflective person had a different assessment of the evidence, I’d definitely want to be sure I considered it and updated my own views accordingly.
In future posts, I plan to explore how OPS measures up against the offensive element of WAR as a whole, as well as how OPS could be improved.
Anyway, if you’d like to perform your own analyses of wOBA, just head over to the stats parlor, where I’ve uploaded data and scripts that enable critical engagement with and alternatives to the analyses I’ve described here.
If you do look at it, you’ll find the remnants of an amusing misadventure I experienced in formulating what I thought was a more powerful variant of wOBA based on multivariate regression. It was pretty powerful all right; it explained an astonishing 92% of the variance in team runs scored. But it was also invalid, I concluded, because the collinearity of the positive batting outcomes that wOBA comprises resulted in silly coefficients or weights for those events. Likely that’s why no one computes wOBA this way!

One Response
I’m glad to learn you are reassured