

There have been 36 .400 hitters in MLB history. But there hasn’t been one in over 80 seasons. The last AL/NL player to reach this mark was Ted Williams, who batted .406 in 1941, and it seems plausible (not inevitable!) that no one will ever do it again.
The seeming extinction of the .400 hitter is associated with one of the most popular baseball-statistics parlor games: the construction of a season-for-season batting average exchange rate.
The motivation is the conviction that the disappearance of .400 hitters can’t be attributed entirely to the superior hitting acumen of the old timers. Game conditions have changed in myriad ways. So is there some defensible method for making the averages of the old timers and the hitters of the last eight decades commensurable so that they can be fairly compared?

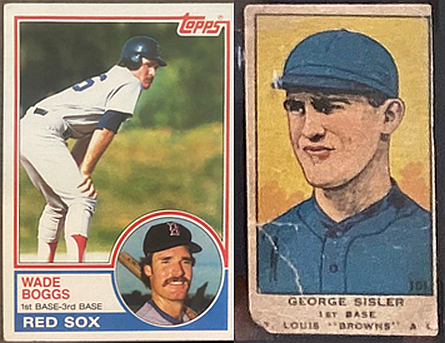
Lajoie’s .426 in 1901 is AL/NL BA record
The strategy employed in this post involves
standardization.
Standardization assigns to normally distributed quantities values that specify how many standard deviations (“SDs”) each one is from the sample mean, a measure conventionally referred to as a z-score. After being standardized, quantities belonging to different distributions can be evaluated on a common scale.
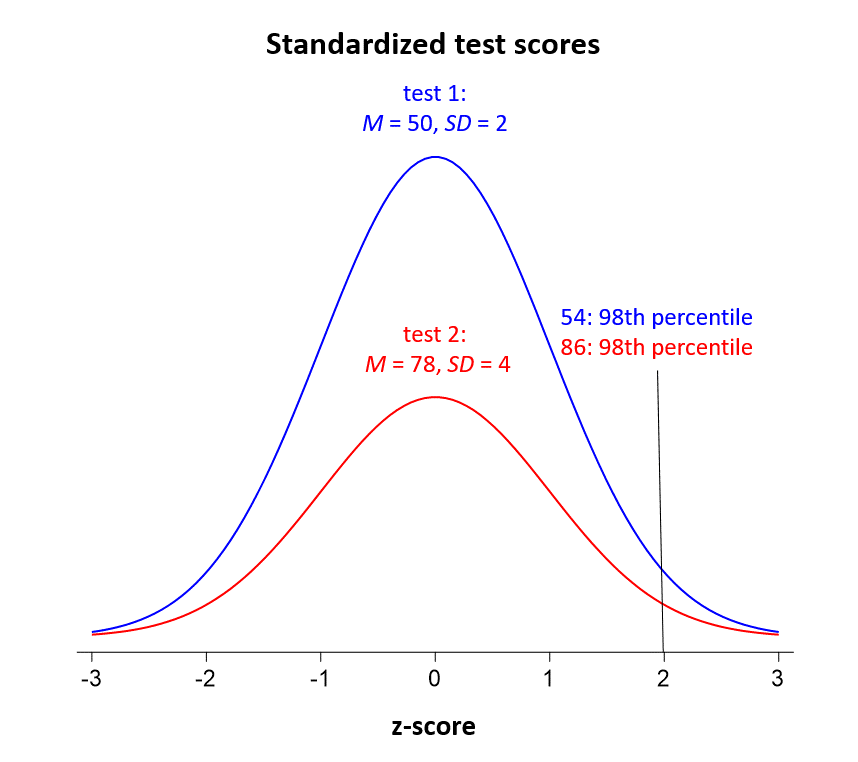
Just to illustrate, say we wanted to compare the performances of students who were administered different math aptitude tests. Although not identical, the tests, we have reason to believe, are equally well suited to measuring a form of computational proficiency shared by the population of students who took either. Scores on the first test, imagine, had a mean of 50 and a standard deviation of 2, the second a mean of 78 and a standard deviation of 4.
After scores on the two tests have been standardized, we could say that a student who scored 54 on the first test did just as well (and thus displayed just as much skill in math) as a student who scored 86 on the second. Both would have z-scores of 2.0. For the population being tested, their demonstrated math proficiencies both equate to percentile rankings of around 97.5, since in a normal distribution, only about 2.5% of the values will be more than two standard deviations above the mean.
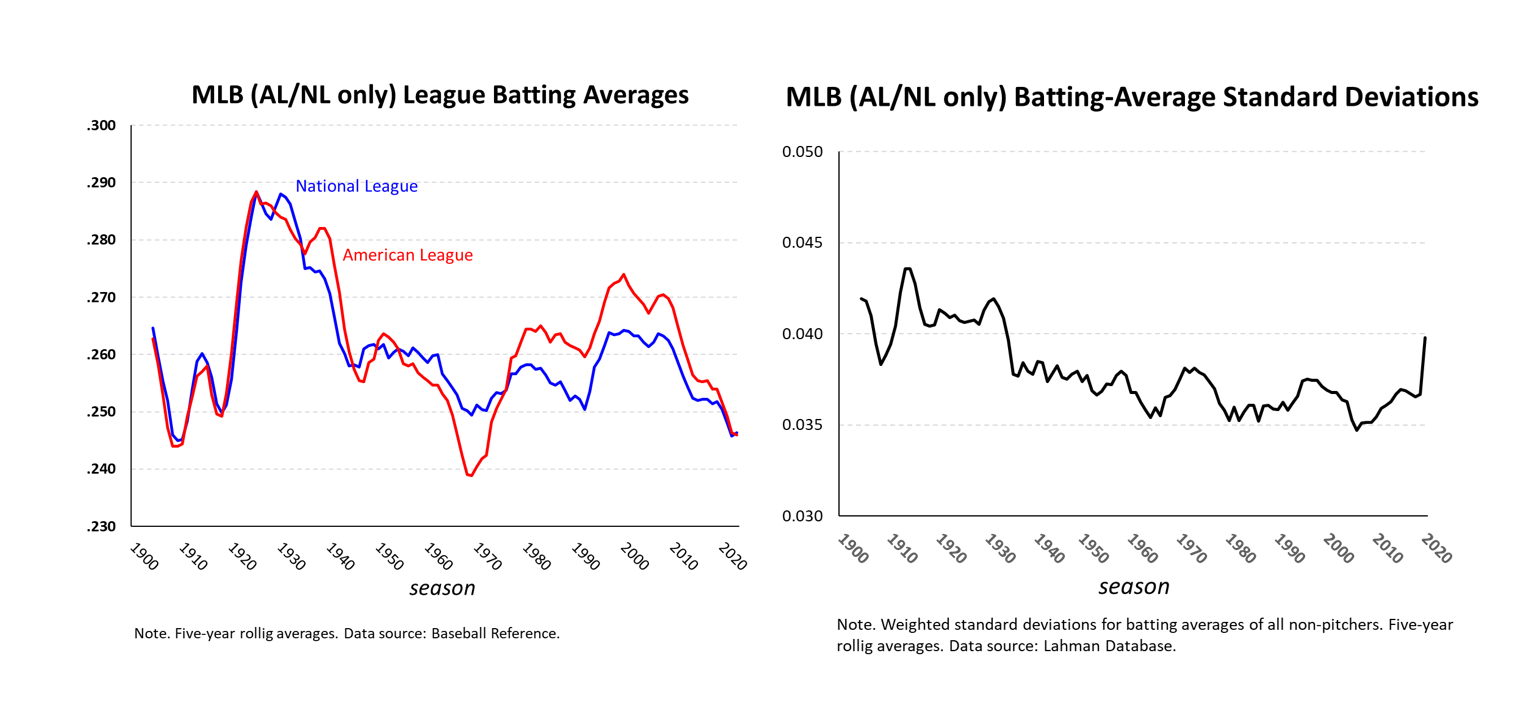
Among major league players who come to the plate at least 150 times, batting averages tend to be very close to normally distributed year-in and year-out. The only things that change over time (a lot, if you look at them) are the means and standard deviations of those averages.
So if we are willing to assume that batting averages over different MLB seasons are equal tests of hitting performance, and that differences in season means and standard deviations capture the “changes in game conditions” that affect batting averages, we can make averages across time commensurable by converting them into season-specific z-scores. Just like in the math-test example, the batting average z-scores would tell us, in effect, how rare it is for players to exceed the hitting performances of their “average” contemporaries by however much they did.
So I conducted this exercise.
I started with the Lahman database’s season batting averages for all AL and NL hitters since 1900 (unfortunately, the Lahman database doesn’t incorporate Negro League stats; I hope they get added soon, at which point I’ll definitely redo the analyses presented here). Using that database, I computed the mean AL/NL batting average and standard deviation for each season. In doing so, I weighted player averages by ABs, and calculated the corresponding weighted standard deviations. A statistical technique common among pollsters and other data scientists, weighting is necessary here to prevent the averages of hitters with small numbers of plate appearances from distorting our measurement of the distribution of baseball-hitting skill displayed by players in a given season.
I excluded pitchers (with the sole exception of Babe Ruth!) on the ground that they are faux hitters whose low averages misleadingly bias downward the mean batting averages, and skew the SDs, of seasons in which one or both leagues lacked a DH. But otherwise, all hitters (subject to weighting) were considered in determining every season’s mean batting average and its associated SD.
Then I simply converted every player’s average into a season-specific z-score. Because all the modern-era AL/NL hitters are now on a common scale, we can determine how more recent batting champions in those leagues stack up against the olden-days .400 hitters. Stack up, that is, in terms of their relative dominance in relation to their respective peers.
You can see the z-scores of all the batting title winners (nine of whom hit .400) in the table at the bottom of this post.
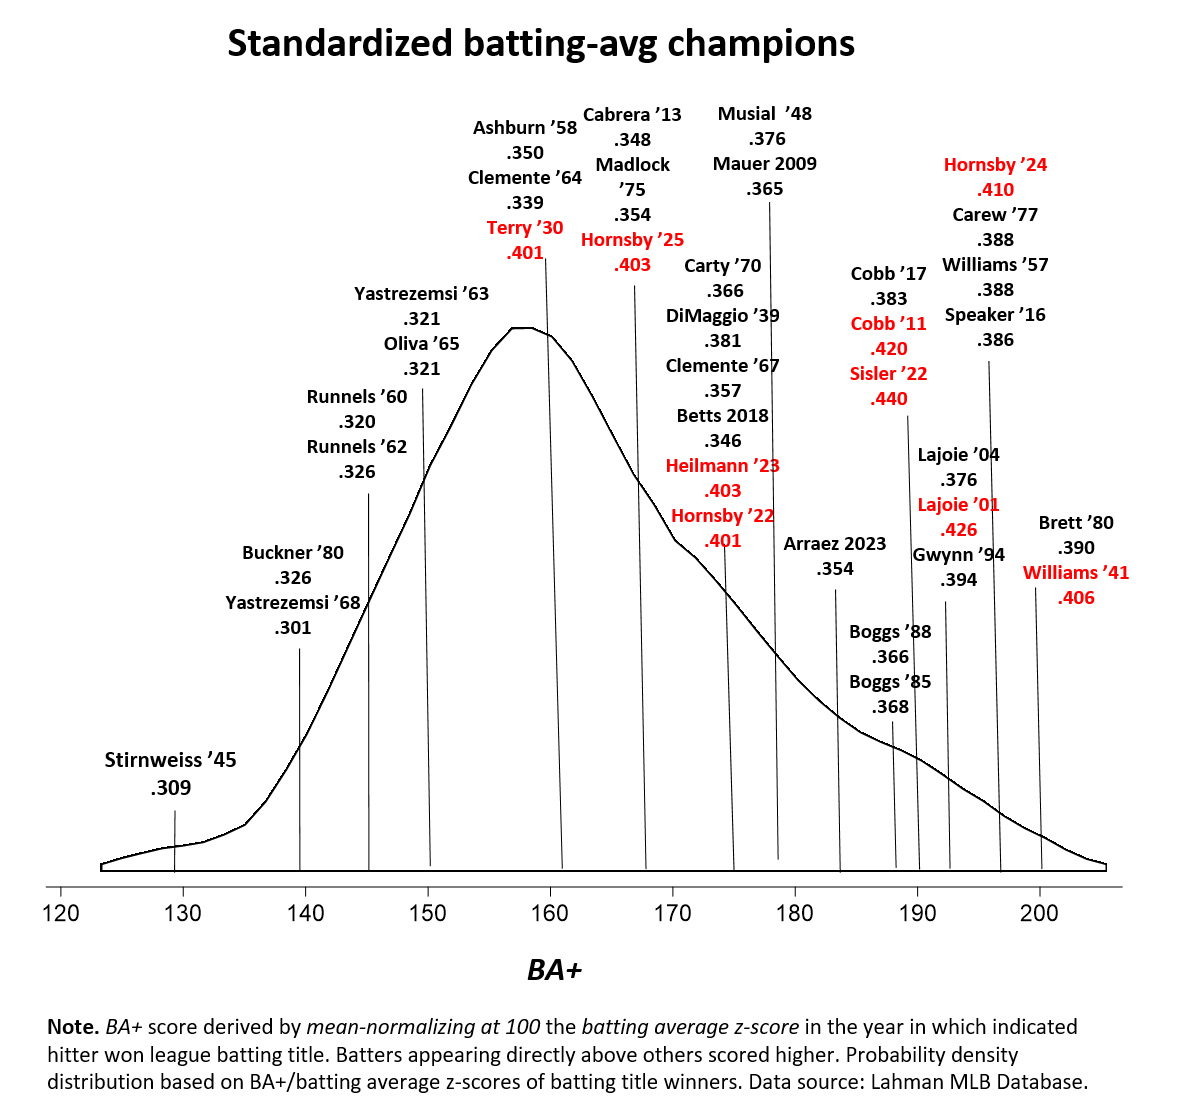
But because z-scores aren’t particularly intuitive to most people, I transformed the scores of all players into values on a normalized scale with a mean of 100. The resulting “BA+” scores are akin to OPS+ scores, which are more familiar to today’s fans.
By displaying the batting-title winners’ BA+ scores in relation to the distribution of all them together (a distribution that’s no different from the one for all the title winners’ z-scores), we can form a pretty good visual picture of the relative dominance of individual batting-title winners from different seasons.
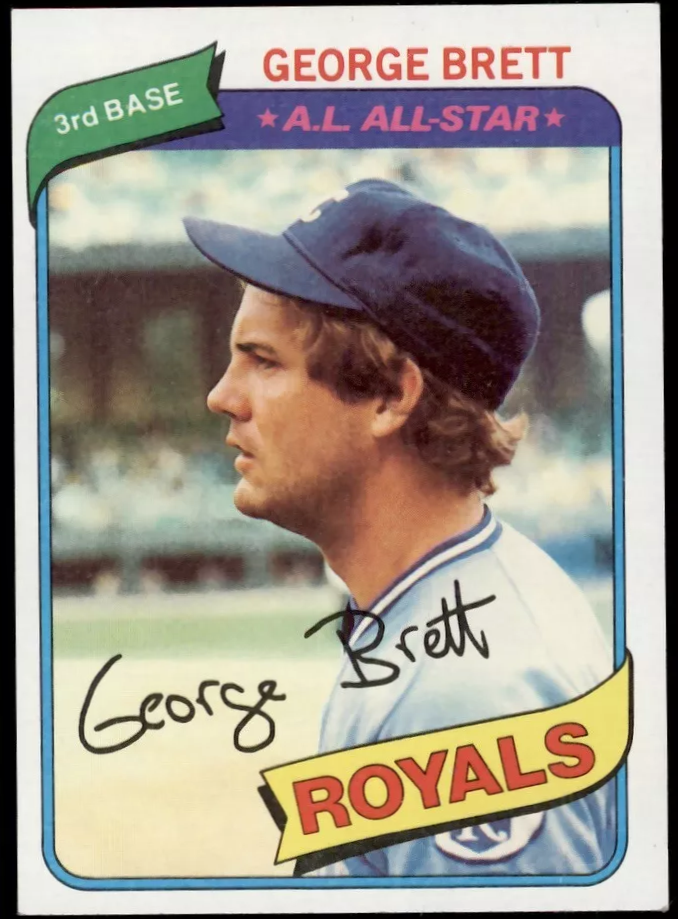
1980: 201 B+, all-time best single-season avg.
So what do we see?
For one thing, George Brett’s 1980 batting title mark of .390 (201 BA+) is the best ever single-season batting average by this measure. He barely edges out Ted Williams’ 1941 mark of .406 (200 BA+). Really, though, they are so close (both had batting averages over 3.1 SDs above the mean ones for their respective seasons) that it would be perfectly reasonable to see them as tied.
There are lots of other interesting things to see, too. For example, the 188 BA+ associated with Wade Boggs’s .366 and .368 averages in 1988 and 1985, respectively, exceeded the 183 BA+ generated by George Sisler’s .407 mark in 1920 (although not Sisler’s sizzling 190 BA+ .420 in 1922).
Rated on the BA+ scale, Roberto Clemente’s .357 average in 1967 was comparable to Harry Heilmann’s 1923 mark of .403 and Rogers Hornsby’s .401 in 1922. Mookie Betts’ 2018 .346 batting average also matched the league-wide dominance reflected in those two .400 seasons.
Luis Arráez’s .354 average in 2023 deserves considerable admiration: the skill it reflects exceeds that associated with two of Rogers Hornsby’s .400 seasons, as well as the .400 seasons of Heilmann and Bill Terry (.401, 1930).

Terry’s is the most “mediocre” .400 average ever to garner a batting crown. With a BA+ of 161, Terry’s performance in 1930 was about “average” for batting champions across the run of modern AL and NL history.
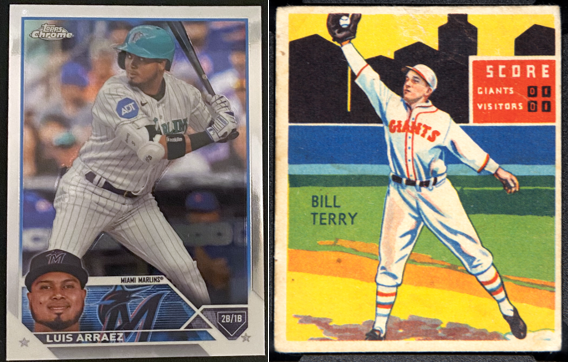
This shouldn’t really be a surprise. Terry achieved his .400 average at a time when league averages were insanely high. No one is really sure why that was so, but we can be pretty confident the explanation is not that baseball experienced a freakish glut of super hitters during that era.
Standardizing batting averages helps to compensate for the uniformly high averages of that period, whatever their cause.
Altogether, 66 post-1941 batting title winners outperformed at least one other title winner who hit .400.
All the same, many of the classic era hitters did produce seasons—multiple ones, in fact—that are among the most dominant in AL/NL history. Ted Williams is a great example. He not only earned the second highest BA+ ever with his .406 in 1941; he also turned in the fourth highest for his .388 in 1957 (tied by 1970s great Rod Carew for his own .388 in 1977)—just behind Rogers Hornsby’s .424 mark in 1924.

Nap Lajoie, who posted the all-time AL/NL record of .426 in 1901, likewise demonstrates his preeminence with two top-10 BA+ performances.
Eight of the top 30 most dominant batting-title championships belong to Ty Cobb.
So for sure, the old-time greats were great. But we’ve been treated in more recent times to outstanding performances that rivaled theirs.
I’m not the first to use the standardization approach to solve the historical batting-average apple-to-oranges problem.
Biostatistician Michael Schell, for example, used it in his superb Baseball’s All-Time Best Hitters and Baseball’s All-Time Best Sluggers.
He also makes a bunch of other sophisticated adjustments, including ones focused on accommodating the broadening talent pool of players over time. Schell’s ambitious goal is not just to create a statistically valid exchange rate for historical BAs and other hitting metrics but to really & truly measure the relative proficiency of the greatest MLB hitters in absolute, timeless terms.

Gwynn’s .394 in ’94 equalled BA+ (193) of Lajoie’s record .426 in ’01
His top season-batting-averages list, though, is pretty close to mine. The biggest difference is that Tony Gwynn, who hit .394 in the strike-shortened (indeed, -terminated) 1994 season, tops his. On my BA+ list, Gwynn’s 1994 season is tied for 8th best ever (with Nap Lajoie’s 1901 .426 performance). In addition to Schell’s use of park factors, his employment of rolling 5-year averages for standard deviations likely explains the difference.
Anyway, check out Schell’s masterful works!
And if you want to come up with your own strategy for putting today’s players on a commensurable playing field with yesterday’s, head over to the data page, where I’ve uploaded the Lahman hitters’ database and the coding scripts I used to conduct my own analysis.
In future posts, I’ll take a look at what happens when we standardize some other metrics, including ones that are even more central to run production than batting average (for reasons that have come to be understood well only in recent years with the advent of even more systematic statistical analyses!).
Post-1899 AL/NL batting title winners ranked by BA+
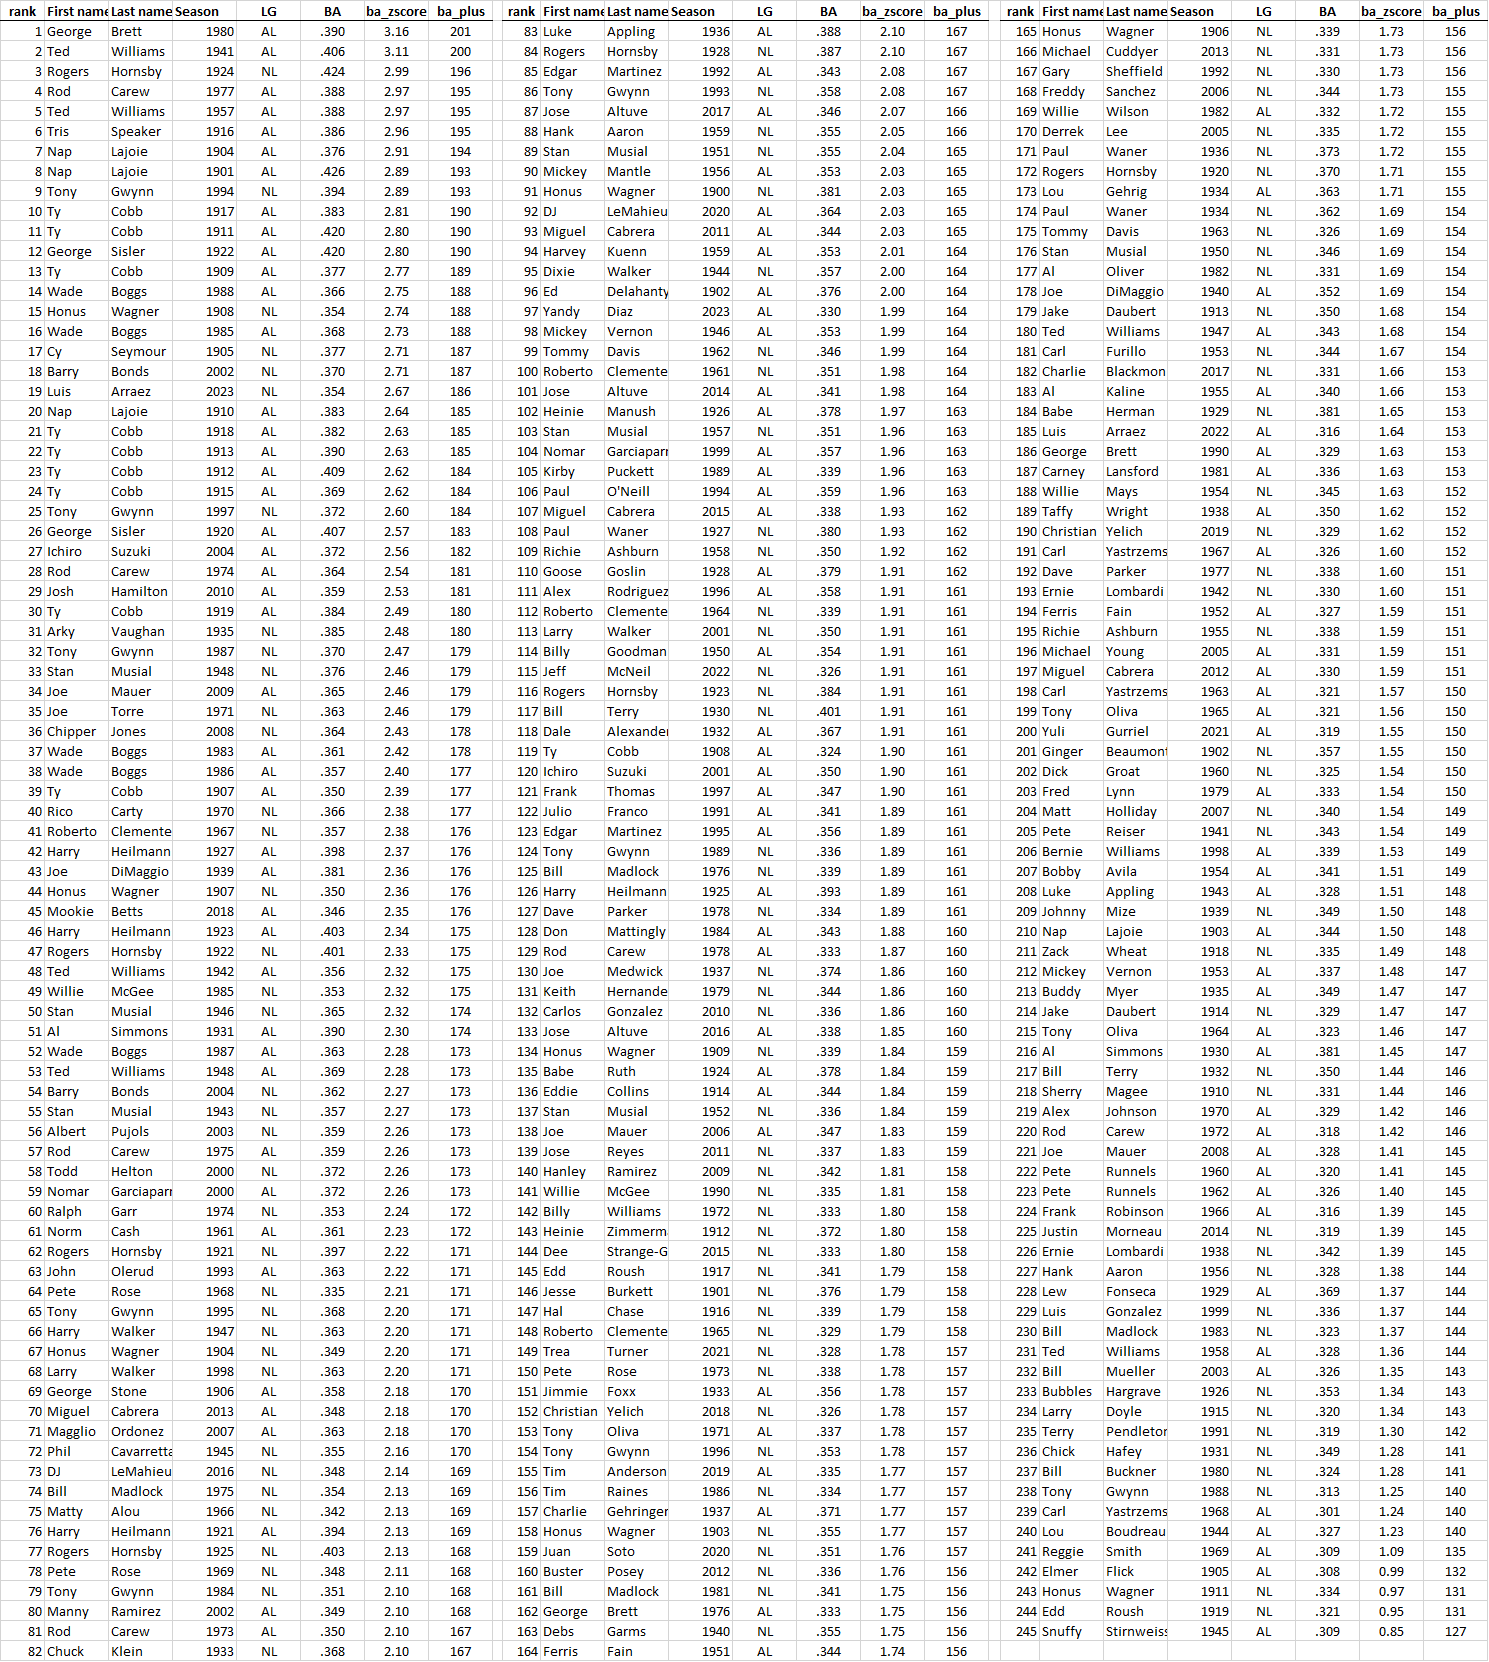

Snuffy: All time lowest BA+ for batting champion