This is my third and (I think) last post on the declining impact of fielding proficiency.
I said in the first that I’d offer a practical illustration of how much less benefit a team of skillful glove men enjoy over a team of mediocre ones.
The illustration involves the 1967 AL pennant race.
It was a wild one! Three teams—the Red Sox, Twins, and Tigers—all entered the last weekend of the season with plausible paths to victory (and none of them involved “blue walls”. . . ). When the dust settled, the Red Sox emerged victorious, a game ahead of both the Tigers (who’d win the World Series the next year) and the Twins (largely the same team that had won the AL flag in ’65 and would win the AL Western Division in ’69). The White Sox, too, had been in the chase until the last week.
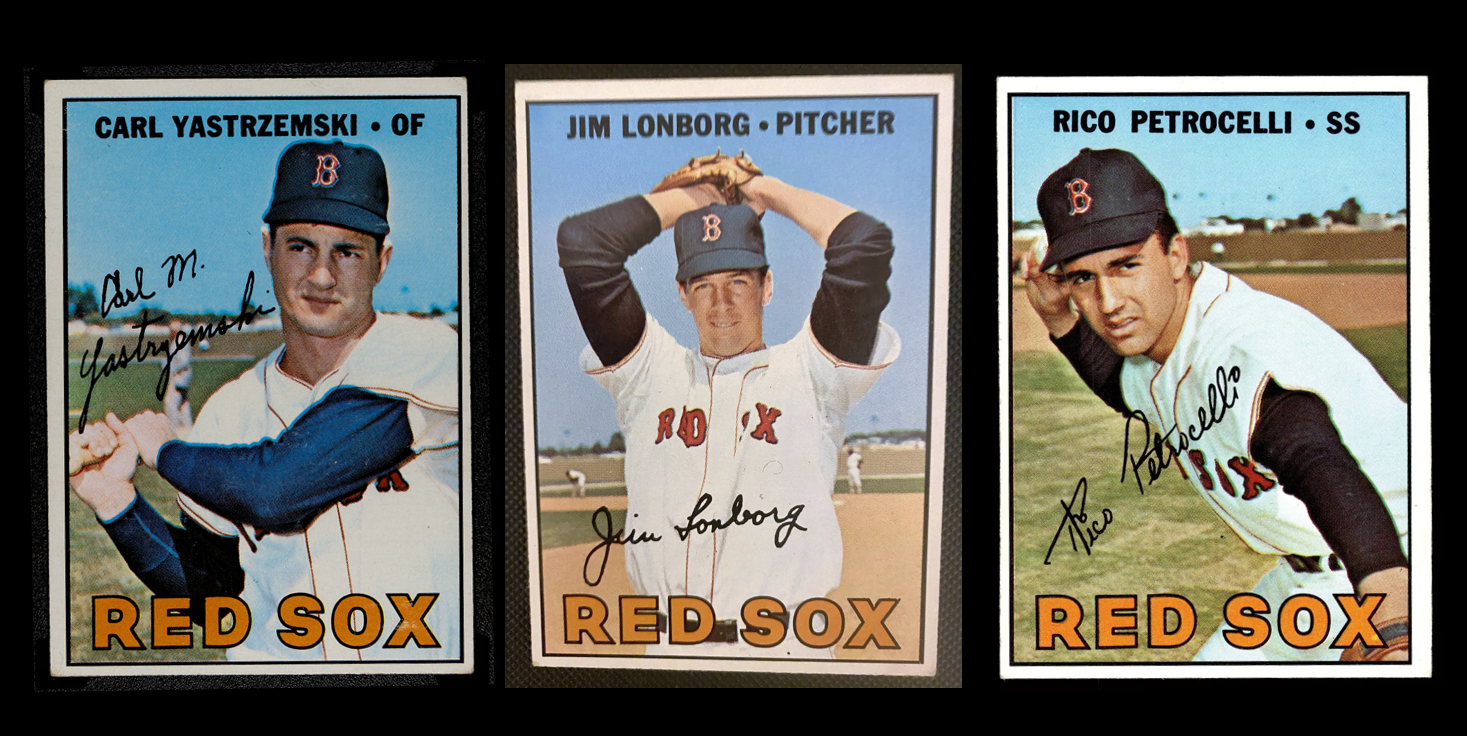
I’m going to focus on the Twins and Red Sox because they had the biggest spreads in fielding proficiency. The Red Sox had a decent “rfield,” or runs saved by fielding relative to a team of average fielders: +37. Their best fielders included SS Rico Petrocelli (+8) and LF Carl Yastrzemski (+23).
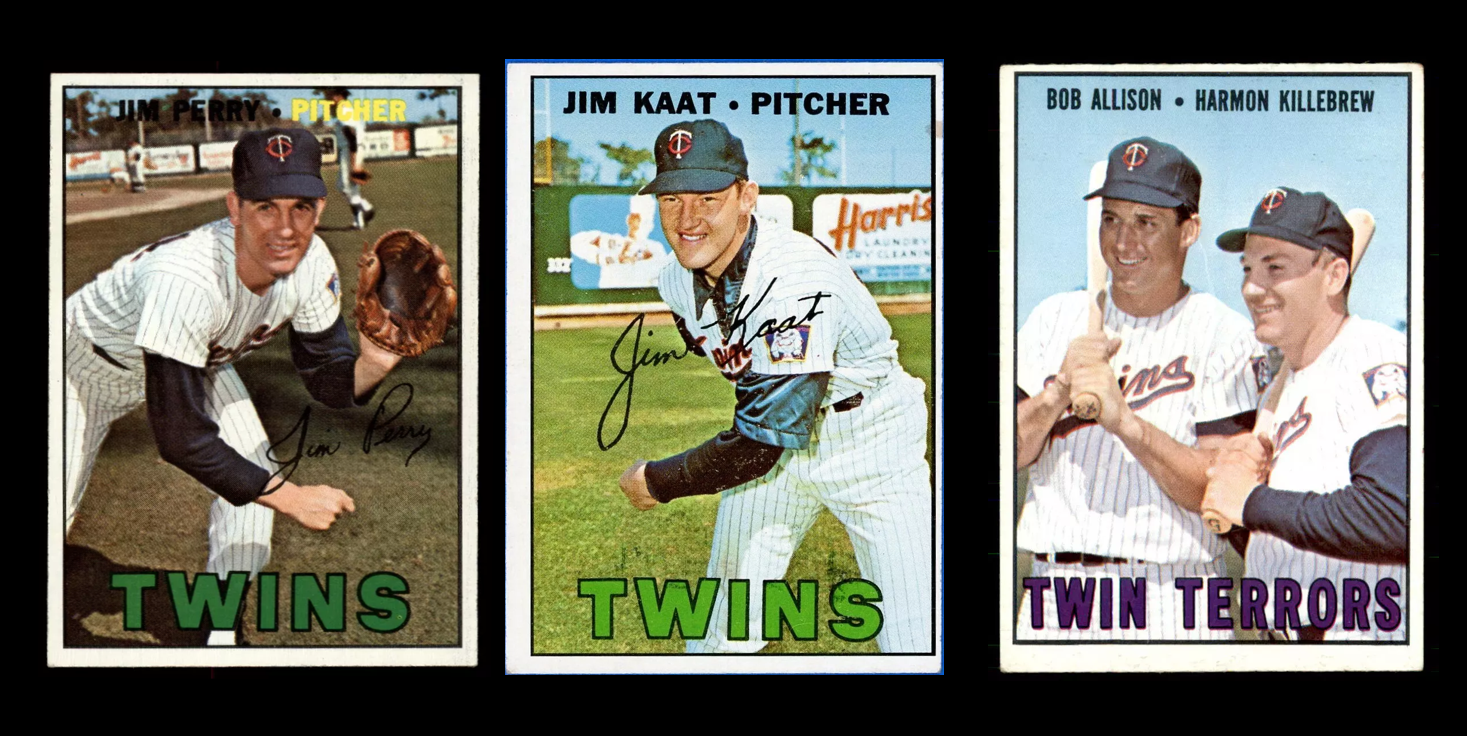
The Twins, well, sucked. Their team rfield was -28. Third baseman Rich Rollins cost them 10 runs with his sloppy play; outfielder Bobby Allison squandered another 8; and slugger Harmon Killebrew, at the relatively safe fielding spot of 1B, still managed to cost them 5.
But the Twins had better pitching. True, the Red Sox had CYA winner Jim Longborg, who sported a fielding-independent pitching or FIP score of 2.95 (FIP is measured on a scale that mimics ERA). But the team FIP was 3.50 compared to 2.97 for the Twins, whose rotation featured Jim Kaat (FIP 2.55; best in league) plus Jim Perry (FIP 3.11).
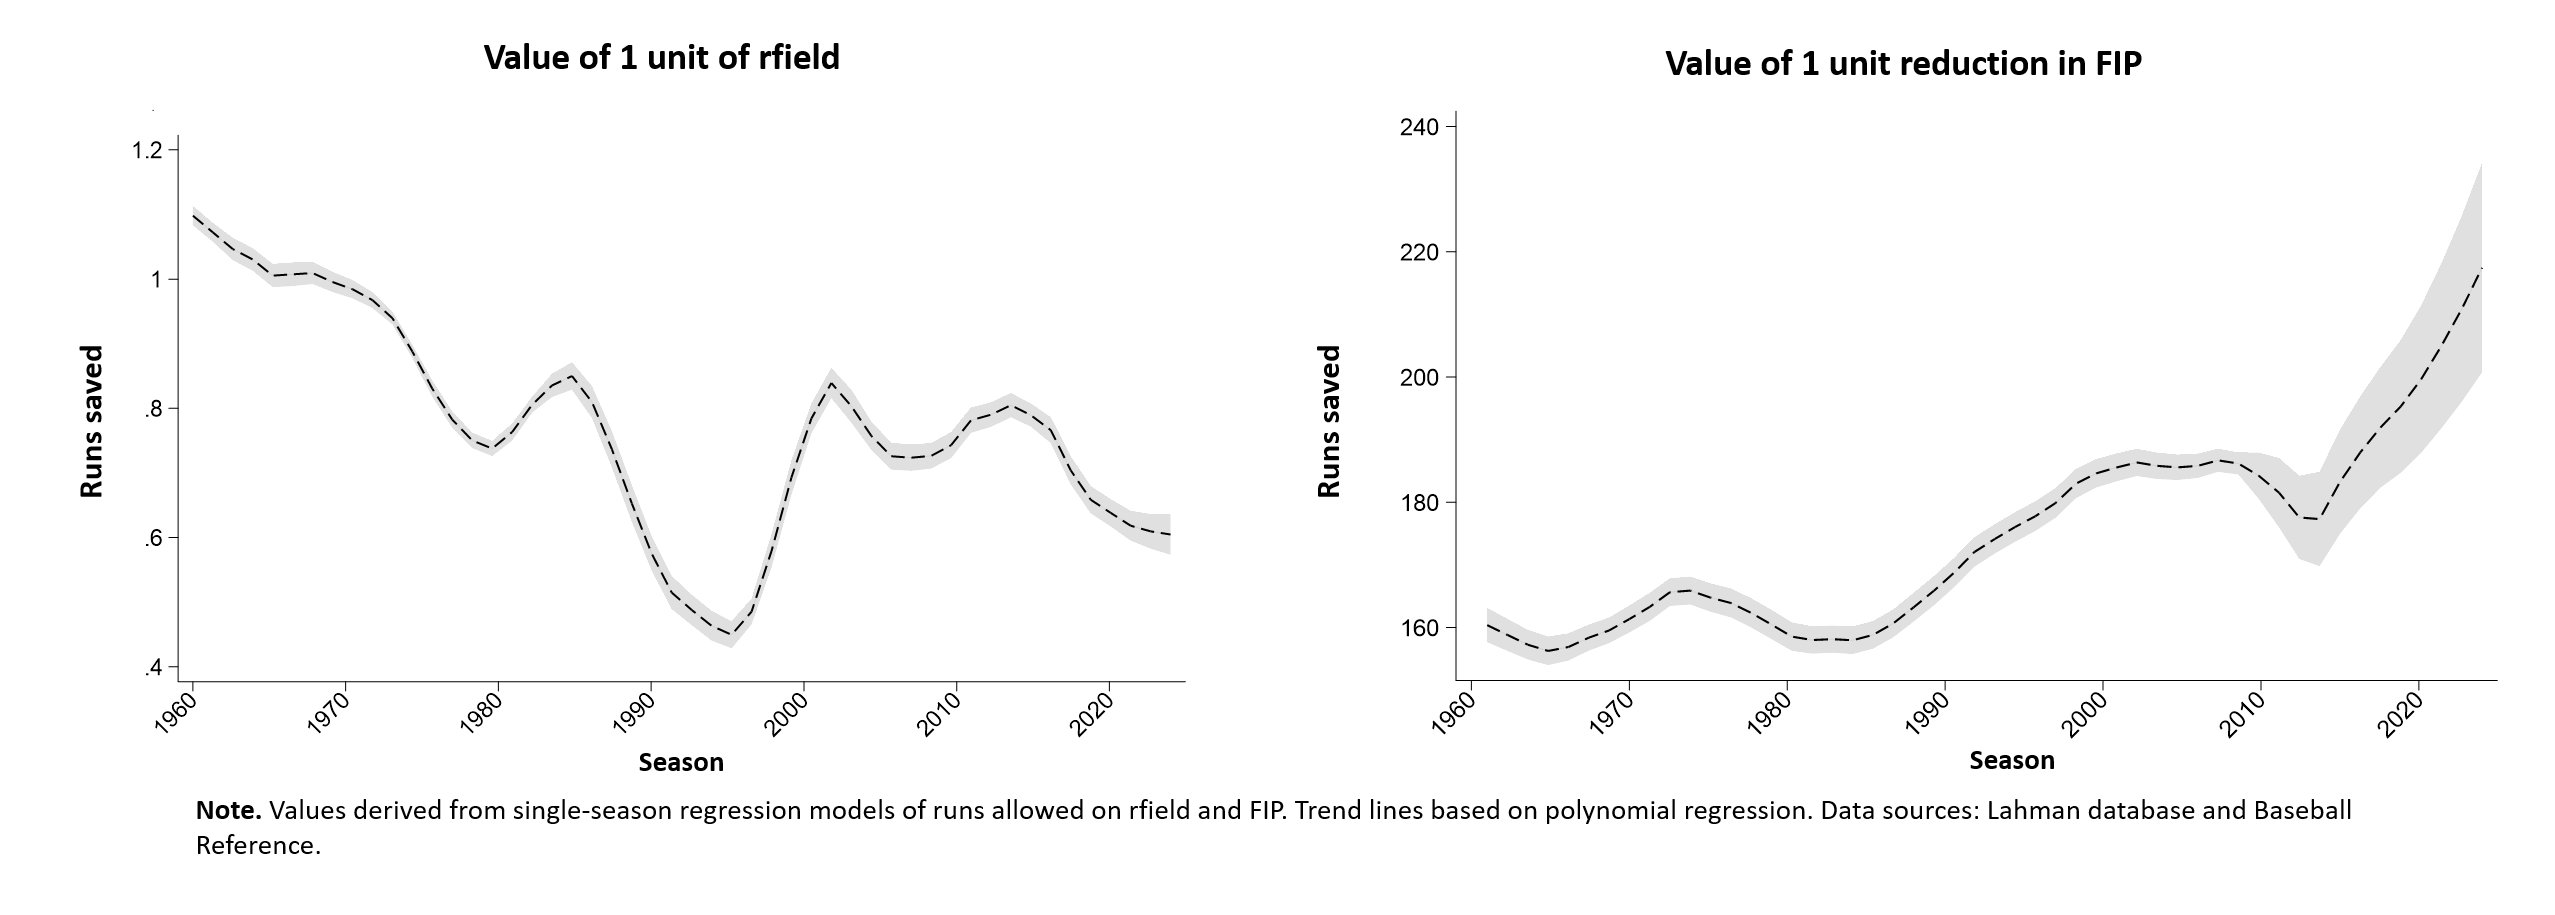
The figure below plots the runs-saved values of rfield and FIP over time. You’ll notice that in the late 1960s, a reduction of 1 unit in FIP was worth about 160 runs saved over the course of a season, and a 1 unit reduction in rfield about 1 run—just what you’d expect. The value of FIP, though, generally increased thereafter, while rfield plummeted (a phenomenon I analyzed in the second post in this series; as for what was going on in the 1990s—basically a temporary measurement problem with rfield—see the first.). By 2024, a unit of rfield was worth only 0.50 in runs averted, and a 1-unit increase in FIP 183, over the course of a 162-game season!

We can use these numbers to estimate the teams’ expected performances in 1967 and counterfactually in 2024.
Based on the squads’ respective FIPs and rfields, the Twins could in fact have been expected to enjoy about a +33 advantage in runs saved over the Red Sox. On the generally accepted premise that a +10 differential between runs scored and runs allowed equates to 1 win over the course of a season (that premise merits empirical investigation too; but another time), the Red Sox would have been expected to have experienced roughly a 3-game deficit to the Twins.
But hitting matters, too. The difference in the two teams’ OPS’s (.719 for Red Sox, .695 Twins), predicts a +38 runs-scored advantage for the Red Sox. On net, then, we’d expect the Red Sox to finish about a game ahead—exactly what happened. (Kind of blows my mind, actually.)
Now let’s imagine the teams had played this season 47 years later.
The Twins would have enjoyed a +78 runs-saved advantage if in 1967 the two teams’ FIPs and rfields had been assigned their 2024 values. That generates an expected difference of nearly 8 victories in the Twins’s favor. Subtracting around four games based on the Red Sox superior hitting (OPS had exactly the same impact on run-production both seasons), the Twins would have won approximately four more games than the Sox.
In sum, the shift in the relative importance of pitching over fielding would could have been expected to generate a 5-game swing in the fates of these two teams—costing the more sure-handed Red Sox the pennant to the fairly clumsy Twins—had the 1967 season been played in a 2024 baseball environment.
That’s not a particularly meaningful notion, of course. Even putting aside the feasibility of time travel, it’s odd to imagine that the performance of teams transported from 1967 would be governed by 2024’s distinctive game dynamics.
But the point of the thought experiment was to help make the computations of the first post in this series—which estimated that fielding matters now only about 1/4 as much as it did then—more concrete.
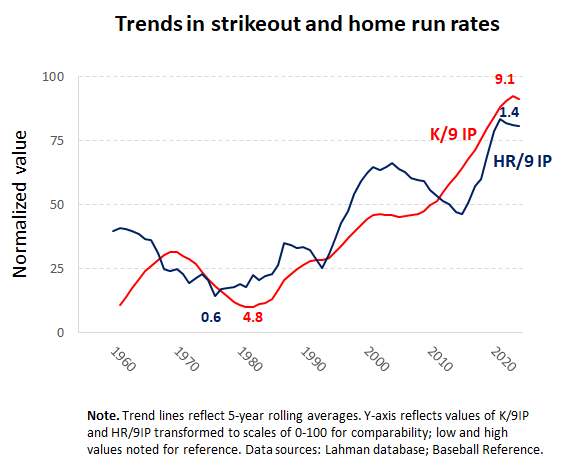
You can extrapolate from this exercise, I hope, to assess how much less a fancy fielder is actually worth to your current favorite team than you might have imagined if your mental yardstick of player value reflects the workings of the game before the advent of today’s strike-out-vs.-home run style of baseball.

The data script in the data section has been updated to allow you to examine the analyses performed here and to explore competing conjectures.


