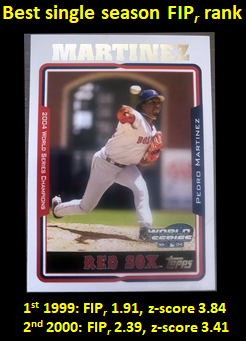
So I thought it would be fun to start the year with another standardized “all-time best seasons,” this one focusing on fielding-independent pitching or FIP.
Before I get to the results, let me quickly review the motivation for, and mechanics of, this sort of analysis.
If one wants to compare historical “best seasons” rate statistics in baseball, it’s usually a mistake to look at raw numbers. Changed game conditions, unrelated to player skills, bend and twist statistics like batting average, on-base percentage, and OPS, obscuring the quality of the performances behind them.
Standardization dispels this variability fog.
 It transforms values from a normal distribution into units that reflect the number of standard deviations they are from the mean. Called a “z-score,” this metric forms a common scale for comparing values drawn from distributions with diverse means and standard deviations—like batting averages from different eras of baseball history. What standardized variants of common statistics tell us is the extent to which a player has outperformed his peers (or hers; women play baseball too and it’s hard to beat the excitement of college softball!) in a particular season.
I’ve previously performed this exercise for batting averages: George Brett’s 1980 season emerged as best ever. And OPS: Aaron Judge ascended into the company Ruth and Williams.
If you want to see it used masterfully in conjunction with a suite of other statistical strategies for achieving historical commensurability, check out Baseball’s All-time Best Hitters and Baseball’s All-time Best Sluggers, baseball’s all-time best historical inquiries by biostatistician Michael Schell.
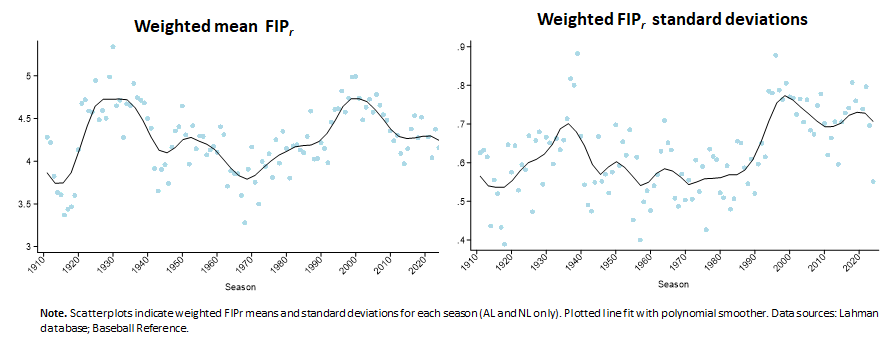
 Here I’m going to report how standardization enables a trans-historical view of FIP. Comprising a pitcher’s rates for strikeouts, home runs allowed, and hit batters, FIP tells us the expected runs a game a pitcher is personally “responsible” for (i.e., independently of any help or hindrance from fielders). Like other rate statistics, FIP fluctuates madly, in patterns no one could believe reflect the uneven supply of quality pitchers. The standard deviations of FIP are also not very uniform, although unlike those for BA and on-base percentage trend upward—for reasons that pose their own mysteries.
Anyway, I did the usual thing: I formed weighted means and standard deviations (using innings pitched as the weighting factor) for every AL and NL season from 1911-2024 based on the performance of every pitcher who logged at least 100 IP. I actually used FIPr, which is a variant of FIP formed with regression-based weights rather than theory-derived ones for pitchers’ strikeout rates, home-run allowed rates, and hit-batter rates. I started with the 1911 season because the Lahman data base doesn’t consistently record hit-by-pitches allowed before then. (I purged the disgraced Roger Clemens from the sample, since steroids corrupt meaningful historical analyses of baseball performance, among other things.)
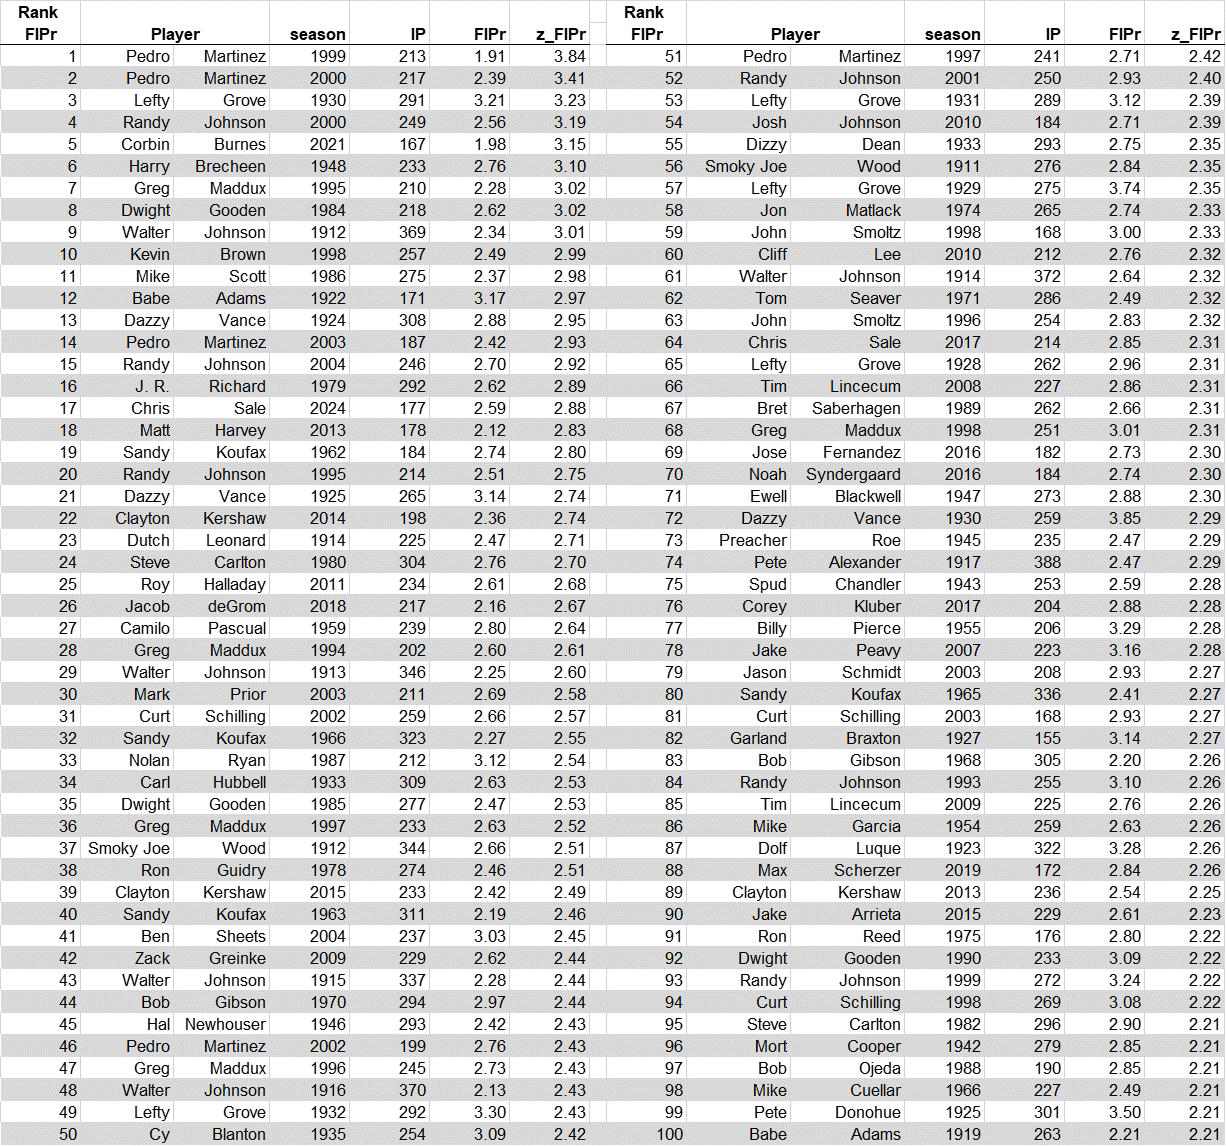
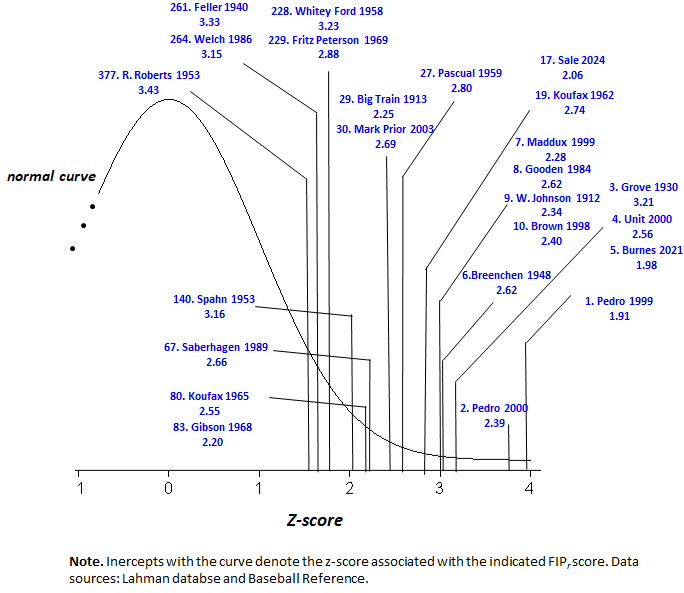
A list of the 100 FIPr performances appears at the bottom of the post. But directly below that is a graphic illustration: it superimposes select performances on the normal distribution of FIPr pitching performances of all AL/NL pitchers. It helps me call attention to what are some pretty interesting things.
1. There’s a lot of counterintuitive stuff going on here
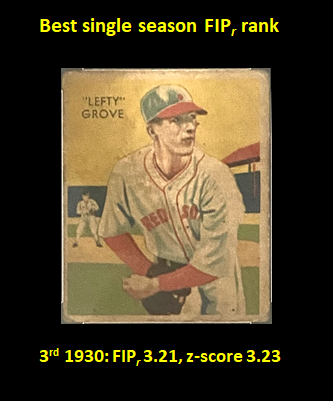
I can accept that Pedro is entitled to recognition for two of the best and possibly even the two best pitching seasons ever. It’s cool, too, to see contenders from a variety of eras, including the 10s (Walter Johnson, 1912: 9th), the 20s (Dazy Vance, 1924: 13th), and 30s (Lefty Grove, 1930: 3rd). And Dwight Gooden ’84 (8th), Greg Maddux ’95 (7th)—cool, cool!
 But on the whole, I really find the results as a whole discombobulating.
For example, Corbin Burnes. Sure he struck out 234 hitters in 167 innings, but did he really pitch as well in 2021 as Lefty Grove in 1930 (28-5, 2.54 ERA) or Big Unit in 2000 (19-7, 341 Ks)?
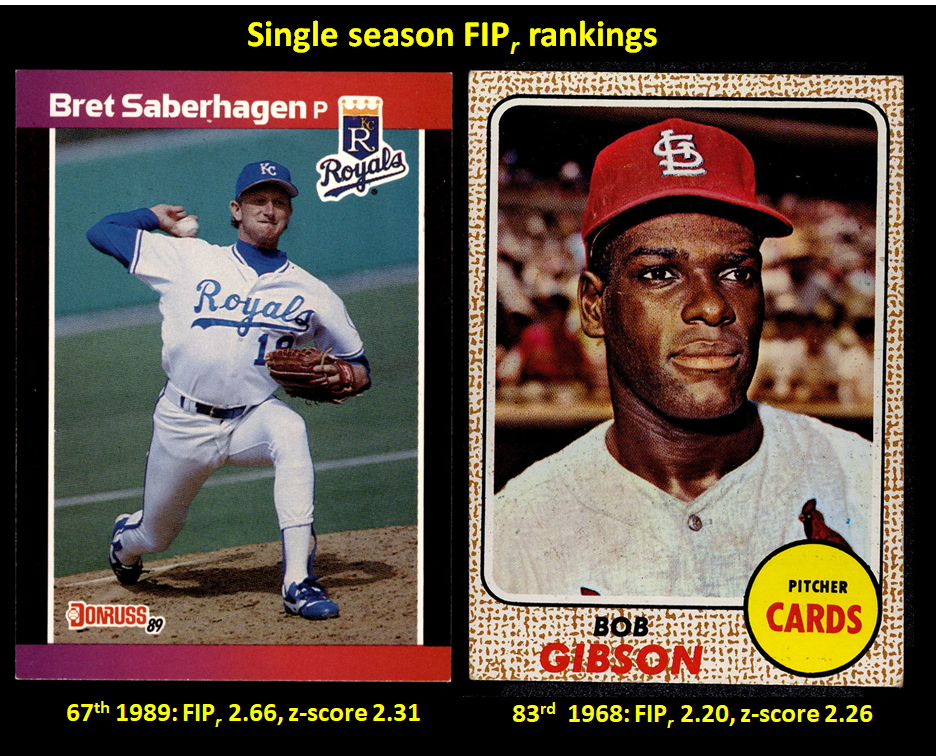
Bob Gibson’s 1968 season (1.12 ERA, 268 Ks) is viewed by many as the most dominant ever. Could Brent Saberhagen’s 1989 performance, as impressive as it was (23-6, 2.16 ERA), truly have topped it?!
Is Bob Feller’s head-spinning 1940 campaign (27-11, 2.61 ERA, 261 Ks) really only the 261st most impressive in AL/NL history?! And not any more so than Bob Welch’s in 1986 (7-13, 3.28 ERA, 183 Ks)??
2. Where are the 1950s??
I’m also really mystified about the dearth of great performances among mid-century pitchers.
I can accept that Camilo Pascual, ranked 28th overall in FIPr, had a decent season in 1959 (17-10, 2.64 ERA). But the best performance of the decade?
 Warren Spahn’s best season (1953) ranks only 140th all time. Whitey Ford’s was 228th (1958)—behind Fritz Peterson’s apparently under-appreciated 1969 season. Robin Roberts, who won 199 games during the ’50s, had his best FIPr season, like Spahn, in 1953—ranking 377th all time.
Seriously? None of those guys had seasons in the top 100, even?
3. The impact of baseball’s “Great Transformation”
But I guess these sorts of results probably can be made sense of.
Pretty much all the violence being done to my pre-analytic intuitions here arise from the elevated ranking of performances since baseball’s “Great Transformation”—from a game that featured a ballet of multi-faceted pitchers and slick fielders trying to disrupt clockwork-consistent hitters into today’s conveyor belt of showdowns between strikeout and home run specialists. Strikeouts, a central component of FIP, have skyrocketed in the last couple of decades. Home run rates, too. Not surprisingly, over that same period, FIP has come to play a monster role in the explanation of variance in team runs allowed.
So, yeah, it seems perfectly sensible that the most dominant FIP seasons would be concentrated in more recent times—a huge contrast with batting average and OPS, by the way!
It follows that mid-century pitchers (and earlier ones) were succeeding on some basis other than what is measured by FIP. (I adverted to this in the post on BBR’s and FG’s Johnson measurements.)
But what was the key to their success? It’s really really hard to find measurable aspects of pitcher performance that rival FIP across any period of baseball history.
So I’m deeply confused—as usual!
But that really is okay. It’s a new year. Learning that there’s even less solid ground for assessment of pitching proficiency than I had previously believed means that there will now be even more to do, even more to learn, over the next 12 months!
If you want to address these issues, feel free—I’ve uploaded the data and my analyses to the site repository. BTW, those analyses also include a parallel analysis for FIP as conventionally calculated—the results are very similar but not identical to the ones associated with FIPr—as well as data that let you view BBR and FG WAR rankings for the indicated seasons (fun!).
