
 1.13.26 Note: working paper version here.
So having recovered from our exciting adventure with Horowitz’s PH, we’re ready for another manager-value measure. This one we’ll call Manager War or MWAR.
We’ll call it that for two related reasons. First, it is derived from player WAR. And second, it shares WAR’s unit of value: extra wins! That makes it considerably more intuitive than Horowitz’s PH (not to knock odds ratios).
The basic idea is really simple. We want our manager-value measure to tell us how much a team’s skipper is contributing to team success beyond the skill of the team’s players. Well, WAR is the premier player skill metric. So all we have to do is figure out what portion of a team’s success unaccounted for by WAR can fairly be attributed to a team’s manager.
That’s a job for regression analysis. I fit a model to team winning percentage for every season. The principal predictor was team WAR per game (season standardized). But I also added a variable for every team manager. Now I didn’t do this for all AL/NL team that have played since 400 BCE—only for the ones piloted by manager with a careers of ≥ 1,000 games. Those are the same helmsmen we evaluated with Horowitz’s PH.
WAR explains about 80% of the variance in team winning percentage (that’s a lot!). Overall, the manger variables explained another 3%. Not overwhelming—but actually believable.
Once we have controlled for team WARs, we can use our regression model to tell us how many win percentage “points” a manager added to—or subtracted from–the teams whose seasons he guided.
If we multiply this marginal winning percentage by games managed, we know how many “extra wins” a manager is responsible for over the course of his career. That’s his MWAR!
But I think the more interesting way to represent a manager’s MWAR value is by figuring out how many extra wins per season he can be credited with. Otherwise career duration tends to dominate and make it harder to assess a manager’s “value added” both in practical and comparative ways.
Actually, the MWAR model estimates a manager’s value in relation to the impact of an average manager of a .500 team. Still, if you accept that there are is an ample supply of prospective managers–reasonably savvy retired players, former managers, current coaches, minor league managers, etc.–who if given a chance could do as good a job as the “average” manager, then MWAR can fairly be treated as a measure of a manager’s value relative to a “replacement” one.
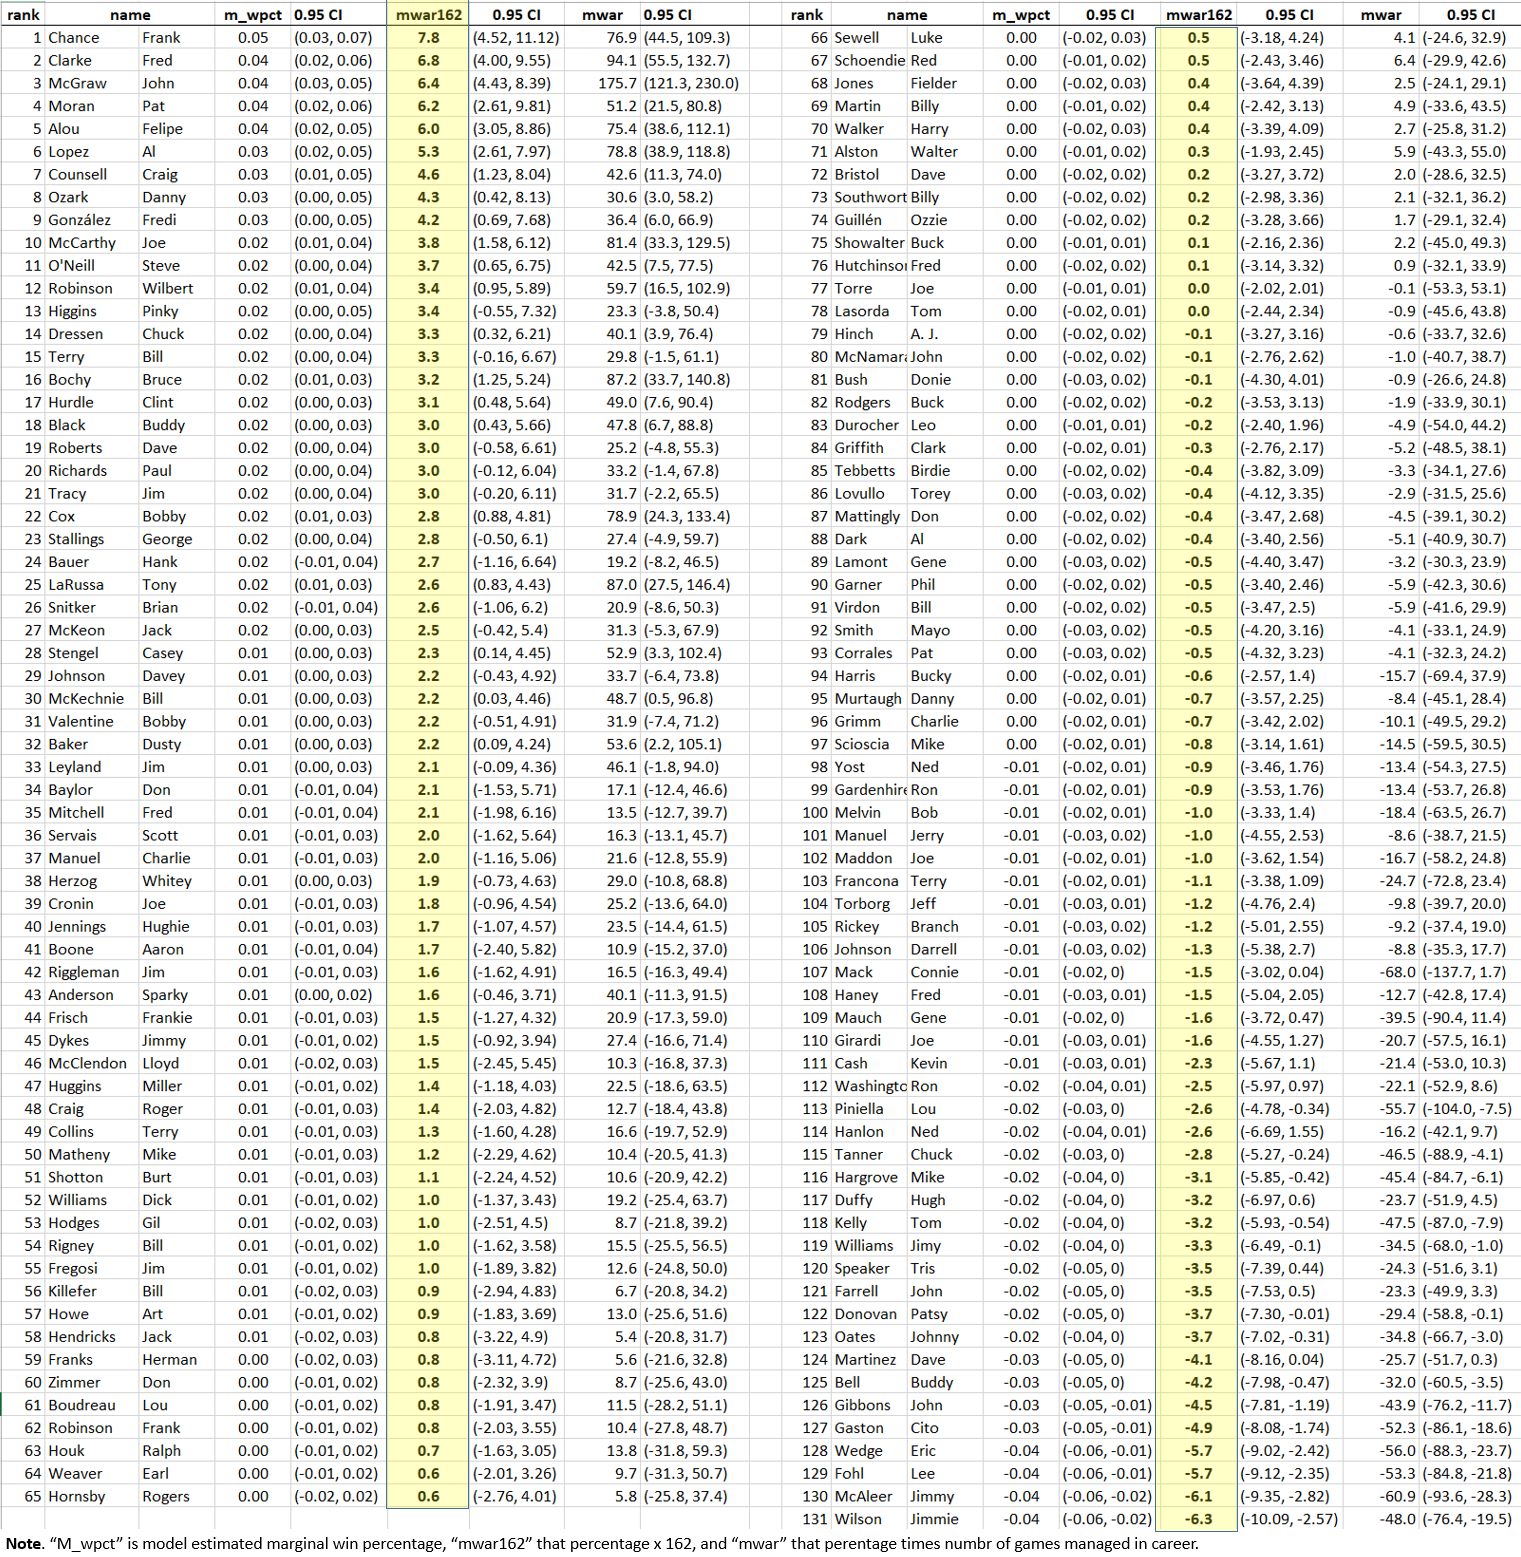
So here is the list, ranked in terms of MWAR_162, for “wins added per 162 games” (a convenient uniform “season” scale).
What to say? Well. . .
1. The list is simultaneously plausible and interesting. It’s reassuring to see McGraw and McCarthy up there. I can accept Frank Chance and Fred Clarke near the top. Boone solidly mediocre—yup. . . . Alou is a sleeper; I could say things about how his MWAR_162 matches his Horowitz PH, but I’m going to save comparisons for a future post!.
 2. Some surprises, though. Dick Williams: MWAR_162 1.0; Weaver: 0.6; Alston 0.3. . .
3. But we can’t be sure they are even that effective.
The reason is the 0.95 confidence interval. Negative MWAR_162s fall within it for all three.
In other words, there is noise in the models marginal win-pct estimates. And they can add up: John McGraw’s career MWAR is 175, ± 54!
But that doesn’t mean, really, that there’s a problem here. I doubt that MWAR is any noisier than lots of metrics, including WAR itself, and also FIP, OPS, etc. The only difference is that this information is being made explicit here and ignored in the reporting of those other measures. As long as a metric is valid and reliable, imprecision isn’t necessarily terrible; what matters is that we know the degree of precision so that we can take it into account when making practical decisions.
4. Don’t some of the estimates, particularly the top ones (7.8 extra wins per season for Chance? Really?), seem kind of unrealistically big?…
5. But hey we’re not nearly done yet!
This is all very interesting and promising I think, but we need to give MWAR the same kind of close, Bayesian interrogation we gave Horowitz’s PH.
 In particular, we need to construct an empirical null with which to compare the marginal win. pct probabilities that inform MWAR. We need to do that because the real random distribution of that variable might be a lot wider than the “normal” distribution used to calculate frequentist 0.95 CIs; if so, lots of what look like “significant” MWARs might turn out to be more consistent with chance than with a true contribution to team success.
At the same time, the observed distribution might contain some managers whose value-added is being concealed by our having access only to the distribution of MWARs that made up our sample. We are, after all, dealing with the managers of longest career service, so were failing to measure them the full distribution of managers, many of whom were too mediocre to last more than 2-3 seasons. This is an instance of survivor bias; an appropriately crafted empirical null can help offset it.
Part and parcel of constructing the empirical null is the application of empirical Bayesian analysis, which we’ve seen can shrink and also change the order of estimates.
So you know who we need to call on, for help here, right?
You go it: our roomful of monkeys with Strat-o-Matic sets!
So stay tuned: the estimator assessment is over until the fat chimpanzee screeches!