 This is the third instalment in the “let’s look at BIP pitcher tendencies . . . .”
The overall project is aimed at some big questions in the study of baseball performance: Does any pitcher-specific propensity genuinely limit the quality of balls hit in play? If so, what sorts of pitchers and which pitchers in particular exhibit this propensity? What is the impact of this propensity, if it exists?
I feel reasonably confident in my Retrosheet-derived data, which displays various encouraging indicia of reliability and validity, including reasonable correspondence with (and some interestingly more discerning qualities than) Baseball Info Solutions data from 2002-2024.
So now I’m turning to the task of using the data to estimate the impact on runs allowed.
To that end, I introduce: “Ball in Play Runs Below Average,” or BIP_RBA!
Actually, let’s make it BIP_RBAb for “beta,” sine I anticipate refinements, which I’ll discuss at the end of the post.
Here’s the basic mechanics:
(a) Construct 7 season-set regression models for runs per game allowed on fielding-independent pitching, team fielding, infield-pop-up rates, and outfield balls in the air rate.
FIP (or FIPr) and fielding (measured with a composite measure comprising the most highly explanatory team fielding runs-allowed metrics) are essentially control variables, so that we can be sure we are isolating the independent contribution that BIP tendencies make to run suppression.
 Infield pop-ups and outfield balls in the air seem to be the best combination of positive BIP indicators (better than “ground-ball percentage” alone, for sure). The higher the former and lower the latter, the better for suppressing runs.
The models were based on seven distinct sets of seasons: (1) 1912-1919; (2) 1920-1942; (3) 1943-1962; (4) 1963-1976; (5) 1977-1992; (6) 1993-2009; and (7) 2010-2024. Binning seasons is necessary to assure the models from which the IF-pop-up and OF-airball parameters are derived are not unduly affected by season-to-season variability and to confine the models to periods of the game that involve roughly equivalent game dynamics. The seven bins I used reflect periods that featured roughly equivalent runs per game.
The models were then fit to samples consisting of every AL/NL pitcher who compiled ≥ 100 IP in a season within the relevant period.
(b) Apply the model on a season-by-season basis to every AL/NL pitcher who has qualified for an ERA title in the relevant season.
This involves using the model parameters to estimate runs suppressed based on the difference between a particular pitcher’s BIP rates and the AL/NL average for those rates. This will tell us how many fewer—or more—runs than average the pitcher (were he getting the same fielding support as the pitcher in question) would be expected to yield based on his BIP tendencies. The “average” IF pop-up and OF-airball rates are the aggregate ones, weighted for innings pitched, for the period in which that pitcher’s season occurred.
When we evaluate this metric for each pitcher who threw enough innings to qualify for an ERA title for every 3-consecutive season stretch in which he played, the Cronbach’s α is 0.69. This is a measure of metric reliability or consistency. The score is certainly acceptable. BIP_RBAb is definitely measuring something real, albeit without as high a degree of reliability as either of the two BIP measures on which the underlying model is based.
Again, I’ll address presently my plans to refine this version of BIP_RBA. But this is a good first cut, from which we can learn something about the performance of this strategy.
This is what the distribution of BIP_RBAb looks like based on the 8,000 qualifying pitchers examined over the period 1912-2024:
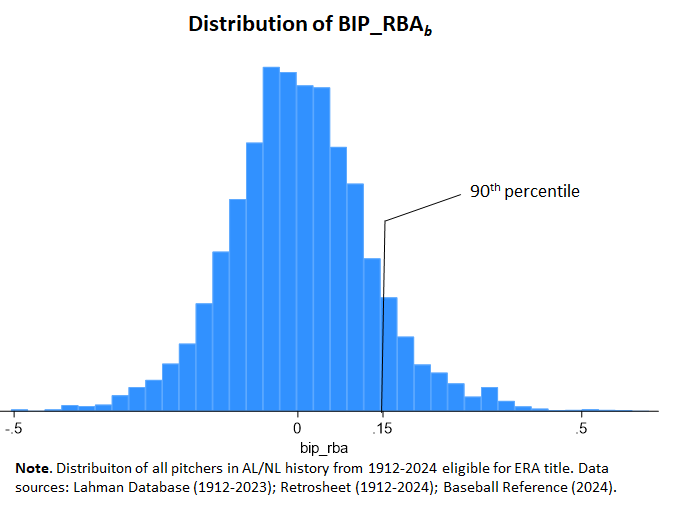
It displays relatively high “kurtosis,” meaning that the peak is higher than expected and the tails fatter. There will be more values at the extremes than in an ideal normal curve. But that doesn’t mean, necessarily, that the metric is deficient; it might just reflect the way the measured characteristic presents itself in the world. This distribution could occur, e.g., if there is a high degree of heterogeneity in BIP propensities, with some classes of pitchers relying very heavily on them and others very little for their persistence as major-league pitchers.
Over the expanse of AL/NL history, the 90th percentile for season BIP_RBAb is around 0.15—or 0.15 expected runs below average per game due to BIP propensities. That’s a healthy, if not overwhelming, impact on an the opposing team’s offensive potency.
So let’s try to get a rough sense of who some of the most consistent BIP run suppression pitchers have been in these two leagues by looking at the number of seasons in which pitchers have hit this threshold:
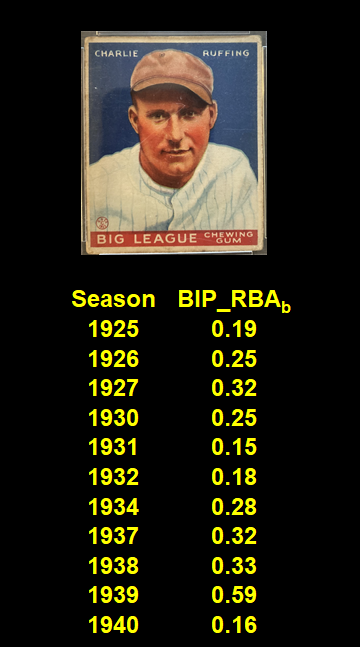
No. 1 is Hall of famer Red Ruffing He had eleven seasons in which he posted a BIP_RBAb at or above 0.15. He managed to amass 273 career wins and a career WAR of 68.6 with an average standardized FIPr of 0.27—about the 61st percentile among every AL/NL pitcher who has ever qualified for an ERA title. Seems plausible that his BIP propensities were largely responsible for his success.
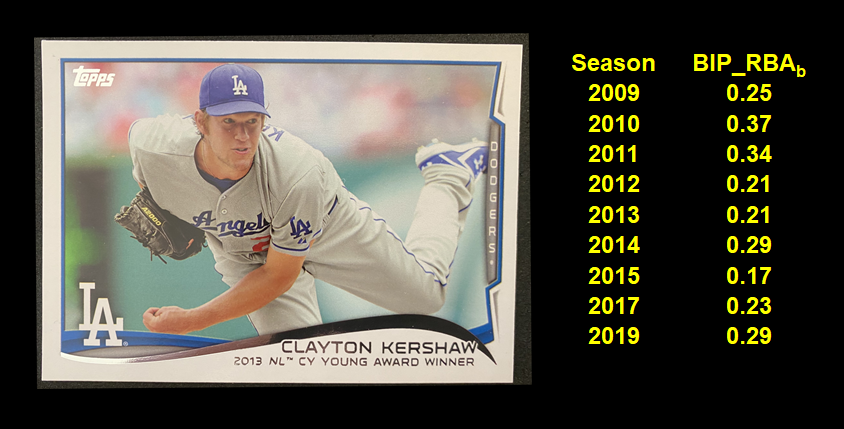 Next is Clayton Kershaw with 9 ≥ 0.15 BIP_RBAb seasons. Kershaw is obviously a great pitcher. His average standardized season FIPr is itself well above the 95th percentile for all regular AL/NL pitchers in history. But maybe he has enjoyed an added boost from the poor outcomes of that occurred when batters facing him did manage to connect.
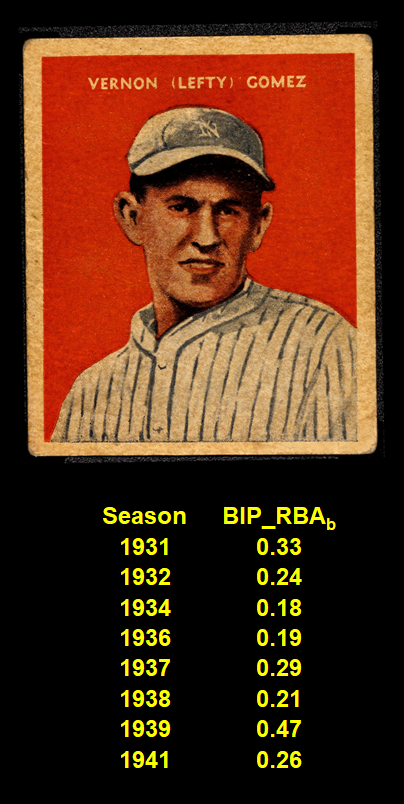
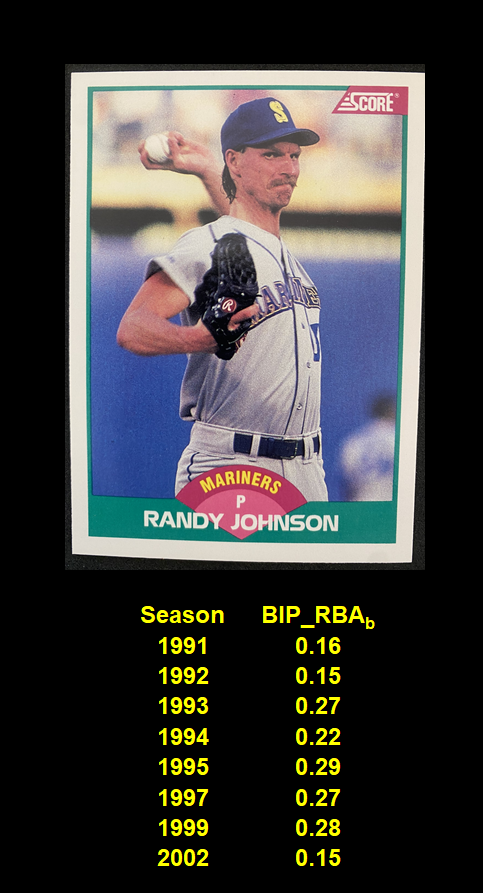 The next two are Hall of Famers: Randy Johnson and Lefty Gomez, each with 8 seasons at or above 0.15 BIP_RBAb. Johnson is another pitcher who seems clearly to owe his success to preventing hitters from connecting at all.
Like Ruffing, though, Grove, a dominant 1930s pitcher, made his mark well-before baseball’s “Great Transformation,” and posted a fairly modest career average season standardized FIPr (65th percentile).
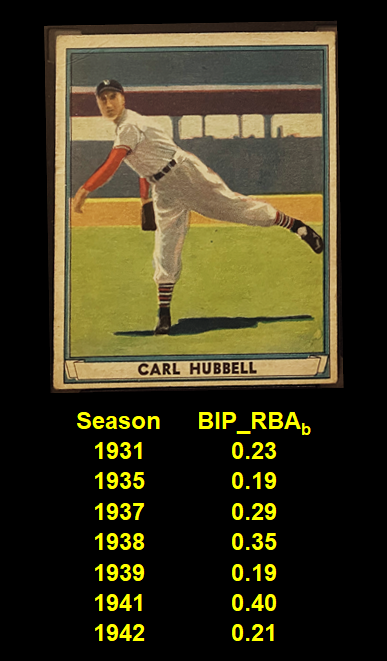
Carl Hubbell had 7 ≥ 0.18 BIP_RBAb at or above 0.15 BIP_RBAb seasons. Another 1930s standout, Hubbell relied on more than striking out batters to establish his all-time elite credentials.
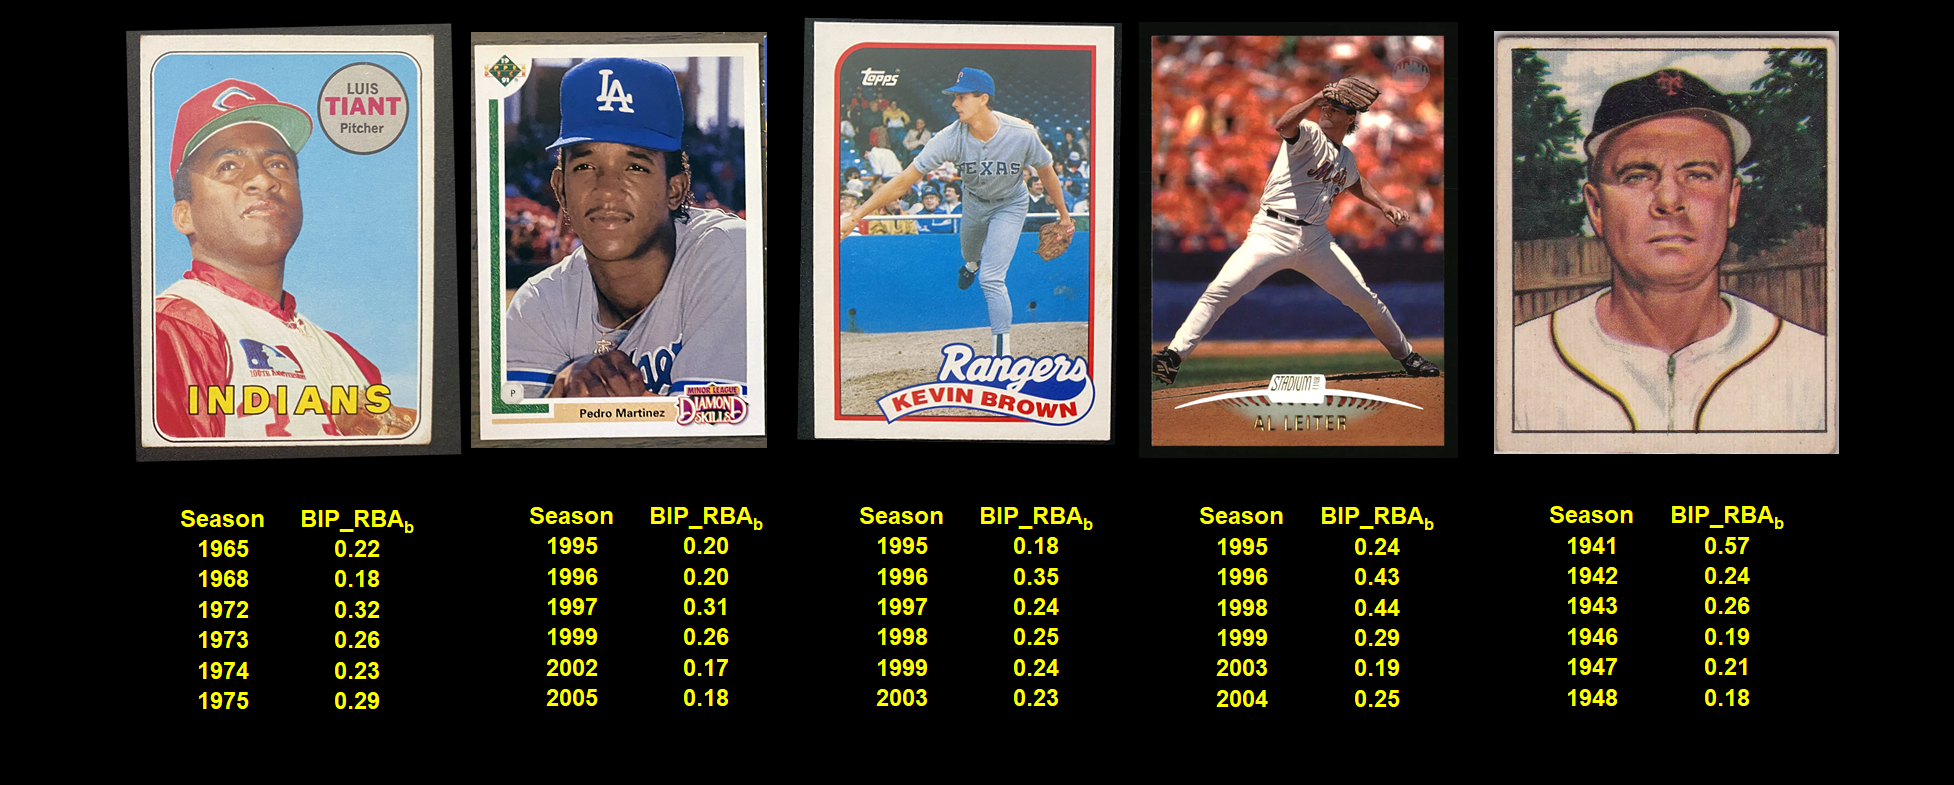
There are five pitchers tied with 6 seasons at or below 0.15 BIP_RBAb. One is Pedro; the richer get richer. . . .
But another is Al Leiter. His standardized FIPrs were pretty abysmal. Yet he managed to eke out a 19-yr career (40.0 WAR). So he’s one who plausibly got some benefit from poor contact.
 Same for Kevin Brown. He amassed an outstanding 67.8 career WAR (211 wins)—while regularly turning in solid but far from outstanding standardized FIPrs, in an era where FIP is clearly a kingmaker for top pitchers.
Luis Tiant is on the half-dozen list. An outstanding pitcher, with an average standardized FIPr smack in the middle of the all AL/NL ERA qualifiers over MLB history.
Finally, is Kirby Higbe. If you know who he is, it’s likely because he was one of the Dodgers who insisted on being traded when the team brought up Jackie Robinson. That act will forever overshadow his modestly successful career, which included two All Star Game appearances—despite his well-below average FIPs.
There’s definitely some more interesting things to say, particularly about knuckleballers.
I’ll get to that! But I think you get the idea for now.
I do want to stress again that this is a beta version of BIP_RBA.
In particular, I want to be more systematic in identifying season “cut points” for constructing the multi-season models used to derive BIP_RBA. I did exercise care in selecting these, applying statistical techniques designed to flush out shifting trends. But I suspect I can improve the placement of the points and maybe increase them.
Relatedly, I want to devise a standardization strategy to make performances across different eras more meaningfully comparable. The assessment I did here is fun but crude; we should really be asking how much better pitchers performed than the mean across the different time periods being modeled.
It’s also likely that I’ll need league-specific parameters for the period in which only the American thad the DH.
And at that point there will be still more to do validate this or any like measure.
But I feel like this is going somewhere! I’m eager to continue down the path.
And if you want to join me, the data are where they usually are. You can also contact me if you have ideas and want to contribute to the effort to advance this inquiry, which his motivated by my sense that reflections on pitchers’ BIP tendencies to date hasn’t been as systematically empirical as would be desirable.