
 So I’m going to try to tell you everything there is to know (in case you for some reason don’t want to just sit down and read the paper!) about this revamped system for measuring pitchers’ BIP propensities.
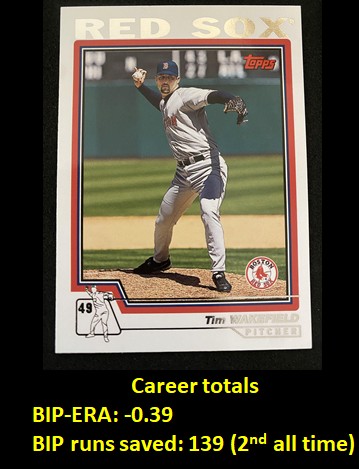
I’m not going to start with “top . . . x” individual-performance lists, though. I’ll get to that (okay, I’ll include little teasers in meantime — like graphic to right). But I want to start at an aggregate level.
If you remember way back to “BIP-RBA ver. 1.0, 2.0,” etc—well this is a big jump forward from there. The data structure is more elaborate—consisting principally in a more fine-grained treatment of ball-in-play types, measured not in terms of rates per IP but rates per BIPs allowed.
Even more important, the modeling strategy is way more robust. Rather than a simple linear regression, the data engine is now a multi-level regression that does a lot better at extracting the impact of BIP propensities between pitchers and across time.
The analytical strategy that drives the model is also more sensible. Think about it like this:
1. Every pitcher’s proficiency comprises two elements: his ability to prevent balls in play altogether; and his ability to mute the impact of BIPs he allows.
For the first, the key variables are his traditional “fielding-independent pitching” metrics—rates of strikeouts, base on balls, home runs allowed, and hit batters (a trivial element, actually) — plus the residual impact of the rate at which he allows balls in play.
The second element consists of the fraction of different BIP types—infield grounders, infield pop-ups, outfield fly balls, and outfield line drives—he gives up conditional on the rate of BIPs allowed. The types vary in their run-productive potential. Obviously, we need to control for a pitcher’s team fielding support to determine the contribution of this component of pitching proficiency to runs allowed.
2. If we have a model that measures the contribution of these variables to runs allowed generally, we can estimate the respective impacts of the two identified proficiency components for any individual pitcher.
First, we subtract from the pitcher’s model-predicted RAPG the estimated RAPG of a composite pitcher with the same BIP-type and fielding-support values but with average FIP and BIP-rate values. The difference is the amount of runs above average a pitcher yields as a result of his ability to avoid balls in play.
Call this his BNIP-ERA.
The “BNIP” part stands for “balls not in play,” since that’s the component of pitching proficiency measured by this metric.
Second, we subtract from the pitcher’s predicted RAPG the estimated RAPG of a composite pitcher with the same FIP, BIP-rate, and fielding-support values but average BIP-type values. This difference is the amount of runs above average a pitcher yields as a result of his ability to mute the impact of balls hit in play.
That’s his BIP-ERA.
Obviously, “BIP” stands for “balls in play” here, since that’s the component of pitching proficiency measured by this metric. For both BIP- and BNIP-, the “ERA” suffix is justified, I’d say, because each measures an element of the pitcher’s RAPG that is due to his performance independent of that of his supporting fielders. Indeed, these ERA components are more accurate than traditional ERA, since the BIP- and BNIP- parts avoid crediting the pitcher for runs saved by superior fielding.
3. Add those together and you get a total predicted RAPG above average for that pitcher, independent of the support of his fielders. It’s a more complete “fielding-independent pitching” metric than FIP conventionally calculated.
I’ll let that sink in!
But realize that if a pitcher-value appraisal system ignores the BIP-ERA part, it will be forfeiting a lot in overall RAPG explanatory power.
Here is a figure that summarizes that cost for Baseball Reference’s and FanGraph’s respective pitcher WAR calculations:

FanGraph’s (which is puzzlingly weak, considering it is based on FIP) gets a boost from 19% variance explained to 34% if we add BIP-ERA. That’s an 80% increase in explanatory power!
The benefit for BBR is smaller—because it’s “expected runs allowed” formula implicitly does take BIP propensities into account along with whatever else a pitcher is presumed to be doing to suppress runs (see Sean Smith’s excellent War in Pieces). Adding BIP-ERA to Baseball Reference’s WAR scores improves RAPG explanatory power by about a third—from 33% to 44% variance explained.
Still, that’s not trivial. Plus BBR’s expected runs formula has the unfortunate consequence of not enabling separate estimates for BIP and BNIP contributions to any given pitcher’s value.
For comparison, the addition of BIP-ERA to BNIP-ERA, the component of the basic model that predicts pitcher performance independent of BIP propensities, increases RAPG variance explained from 54% to 62%, approximately a 15% boost in power. One can infer that neither BBR nor FG’s WAR schemes is capturing all the information on pitchers’ non-BIP proficiencies either. . . .
Well, that’s today’s exposition. More to come.
But if you can’t stand waiting—or want even more detail, read the draft paper. And let me know what you think—I welcome your input on how to make this scheme better!
I haven’t organized my dataset and codes sufficiently yet to put them in the data library, but will soon!