I have a new toy: a dataset of “balls hit in play” that consists of the types of batted balls—infield ground balls, outfield flies, infield popups, etc.—that I coaxed out of the
hieroglyphics that constitute Retrosheet play-by-play event codes, using a program for interpreting the same. There is a very high correlation between my results and the “
Project Scoresheet” Retrosheet companion codes, which I had been steering clear of because of
Sean Smith’s bad experience with them. But his troubles likely had to do with field-position coding, which I’m less focused on for now.
Anyway, the new data is useful for assessing the perpetually disputed
Voros McCracken postulate that pitchers have no influence over the fieldability of balls hit in play. This famous assertion spawned fielding-independent pitching metric of which
FIP (not McCracken’s invention but an obvious application of it) is now the most conspicuous. Everyone keeps trying to prove McCracken wrong—that is, trying to prove that some pitchers limit hitters to more easily fielded batted balls in play—but to me these demonstrations are pretty thin. If he’s wrong (and my priors on that are pretty agnostic), it ought to be possible to do better.
So anyway, here are some preliminary findings based on examining the type “balls in play” (BIPs) hit off every pitcher with ≥ 100 IP for every AL/NL season 1900-2024.
1. There definitely are pitcher BIP tendencies.
It would be wrong to conclude that there’s no relationship between BIPs and the pitchers who yield them. Meaningful, enduring tendencies can easily be extracted from the data. They form continua, with most pitchers falling in the middle, but it’s easy enough to find pitchers who are decidedly more of one thing than another.
E.g., there
are groundball pitchers. If we form a scale based on pitchers’ performances over
three consecutive seasons and consisting of the proportion of BIPs that are hit on the fly to the OF, the proportion hit on the fly in the IF, and the percentage that are ordinary ground balls, the
Cronbach’s α is 0.88.
A “reliability” statistic that generates at measure between 0 and 1, Cronbach’s α allows us to say whether a set of o
bservable indicators are measuring a genuine, enduring unobservable (or “latent”) quality or trait.
Here a score of 0.88 (that’s very high) tells us that, yeah, those three-seasons of performances along those dimensions are
definitely measuring an underlying latent tendency, which practical reason tells us
is a pitcher’s disposition to generate groundballs on balls in play.
Using 3 seasons of data, we can also say that pitchers vary in their tendencies to generate infield popups (α = 0.80); and also, although more marginally, balls hit in the air to the OF (α = 0.68; it’s hard to show relationships between latent variables so measured and outcomes when α < 0.70).
2. Nevertheless, being a ground ball pitcher seems pretty much irrelevant.
I regressed runs allowed per game and opponent batting average for balls hit in play (oBABIP) on an index reflecting pitchers’ propensity to generate ground balls.
After controlling for FIP (
or more specifically FIPr) and team-fielding proficiency (measured with a
composite variable of the strongest fielding measures over various seasons), the marginal contribution of this propensity to variance in
both runs allowed per game and oBABIP was
0%.
3. A tendency to generate infield pop-ups and avoid outfield-fly balls do matter—but likely to only a very modest degree
Like I said, the data also suggest that pitcher vary in their propensities to generate infield popups and to allow balls hit in the air to the OF. If we
aggregate these two types of tendencies, we can observe that they do affect outcomes of interest.
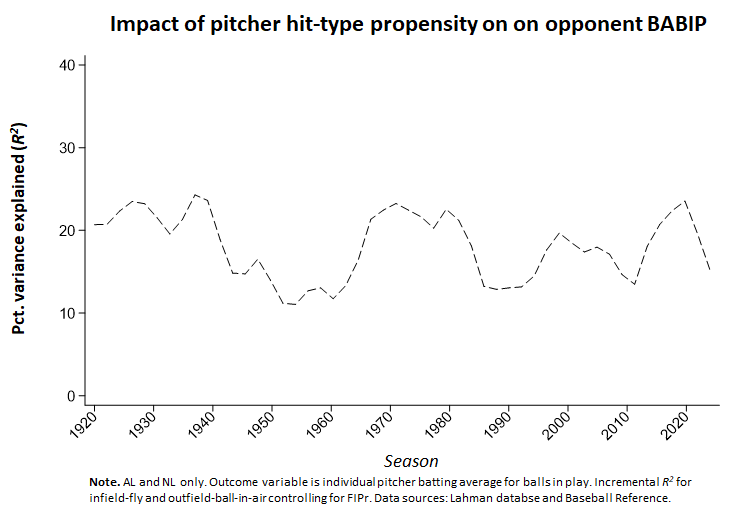
E.g., controlling for team fielding (the only systematic influence on the outcome of BIPs, according to McCracken), these tendencies have account for about 10% to 20% of the variance in pitchers’ oBABIP over the history of AL/NL major league baseball. How much they affect variance fluctuates over time; more fine-grained probing would be necessary to figure out if the fluctuations are meaningful.
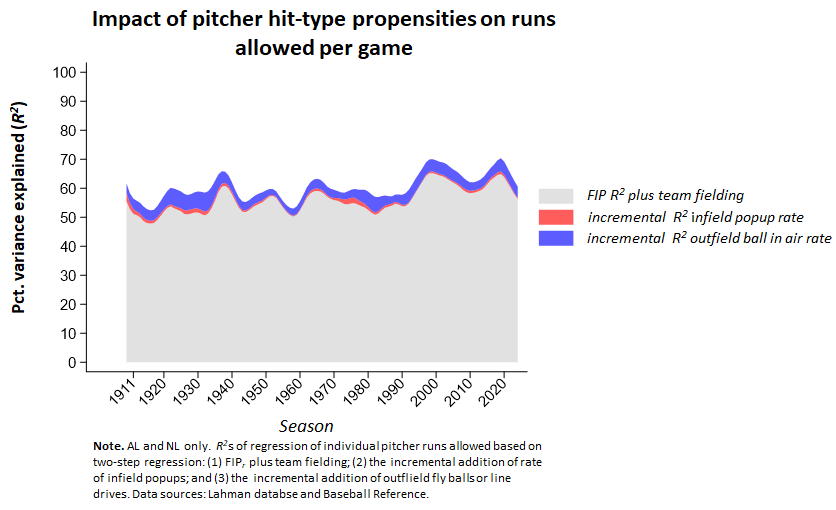
These tendencies also influence runs allowed per game—but to a seemingly much more modest extent. Over the course of MLB history (AL/NL only), they together contribute about 5% to 10% of the variance in runs allowed per game after taking account of FIP and team fielding proficiency. This is the more critical measure, obviously, since oBABIP matters only as a proximate influence on runs allowed.
So what exactly does that mean in practical terms? Well, looking at AL/NL history as a whole, and holding all else equal, a pitcher who was +1 SD (67th percentile) in these two propensities would allow about 0.86 runs per game less than one who was -1 SD (33rd percentile) in them.
Compare that to FIP
r, where difference between +1 and -1 SD is 1.26 runs per game.
Well, that seems like something, right?
But one really important thing to note is that these two tendencies are
negatively correlated with each other. That means that being a pitcher who both keeps fly balls out of the outfield and gets lots if infield flies isn’t really “a thing” in MLB.
If we just look at these two metrics individually, then we find that a 2-SD spread corresponds with a 0.4 runs per game difference for infield-popup propensity, and a 0.46 difference for outfield-fly-ball propensity. And in the great majority of pitchers, these tendencies are offsetting. . . .
 4. More work needs to be done
These results suggest that pitchers have some degree of control over the careers of balls hit in play but that the impact of that control is probably small. FIP is king—exerting a much much bigger influence.
But still, it is worth drilling down deep. Era effects might be hiding in there somewhere. And maybe too a more fine-grained approach would show that these tendencies have contributed to the success of
particular pitchers more than the aggregate data would imply.
In this regard, we’d want to look at the most conspicuous successful “tendency” pitchers.
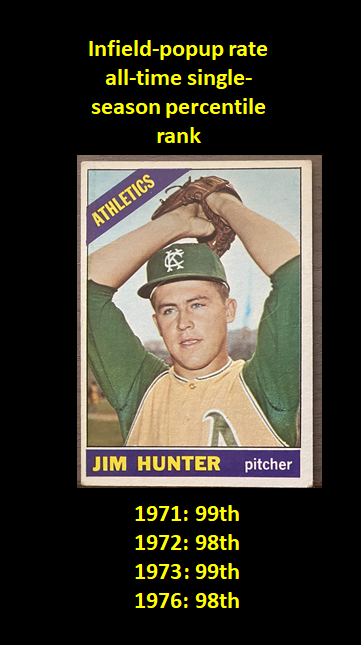
Catfish Hunter stands out in this regard. He had six seasons in his career in which he was well above the 95th percentile in infield-fly balls, three that were above the 98th. He was more middling in fly balls kept out of the outfield, but did manage one season (1974) when he was in the 98th percentile for groundballs. He also happens to be second in career oBABIP for pitchers with ≥ 1000 IP.
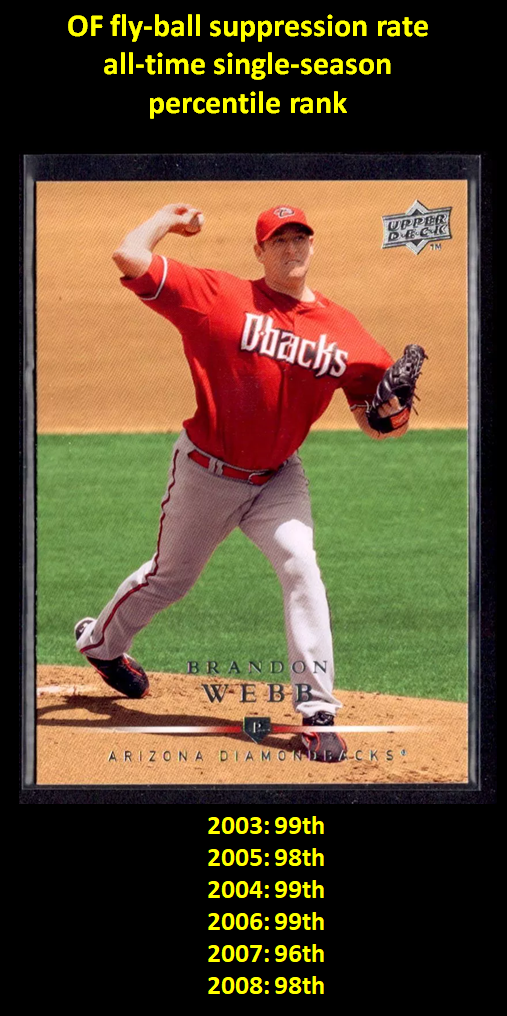
During his short but dominant career, Brandon Webb also had some off the charts outfield-fly avoided marks.
So maybe there’s a there there. (I didn’t find knuckleballers are doing better in this regard, as some have purported to find when looking oBABIP.)
The data should be interrogated (gently; torturing them is sure to yield a specious confession).
If you want to poke around yourself, please do!
I’ve posted data to the data/stats section.
I haven’t included the program I used to generate the hit-type data. I will at some point, but I want to do some more tinkering with it first, particularly with relationship to hit-ball location. If anyone really wants to see it, though, contact me (xavier_funf@bbcardstats.com).
