
 The answer depends on what you think of the validity of a measure of managerial value we’ll call Horowitz’s PH, which was invented by the late business professor Ira Horowitz.
Now you might be inclined to say Horowitz’s PH must be invalid because obviously Aaron Boone is not the best manager ever — he’s the worst (at least according to New Yorkers right now). But I would encourage you not to react that way!
Rational thinking involves updating beliefs based on valid evidence—not using existing beliefs to determine whether evidence is valid. The latter approach is called confirmation bias. It’s not good!
So what we should try to do in the face of this startling claim is assess Horowitz’s PH on the basis of baseball-knowledge/belief-independent grounds for determining evidence validity. That’s what I’m going to try to do here.
So what is Horowitz’s PH?
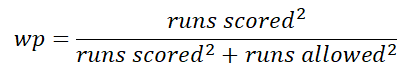
In essence, it is a way to use James’s Pythagorean Expected Win-percent formula to test a manager’s level of skill. The formula, I’m sure you know,
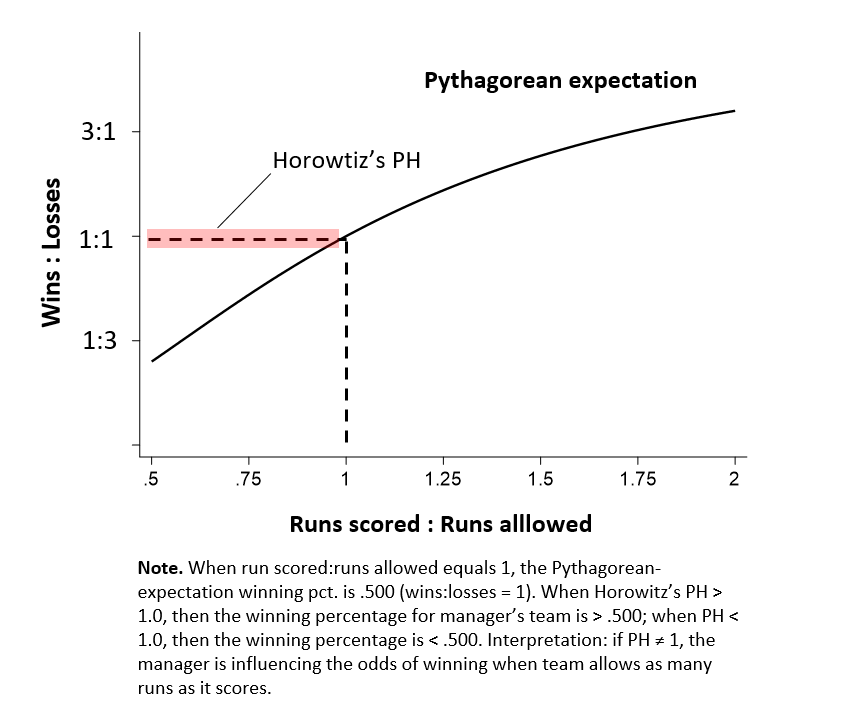
To be faithful to derivation of Horowitz’s PH, we need to transform it into an equivalent one about relationship between two ratios, wins:losses and runs scored:allowed. The math is not that hard–but you can actually skip ahead to the Figure below, which lets you see all you need to now.
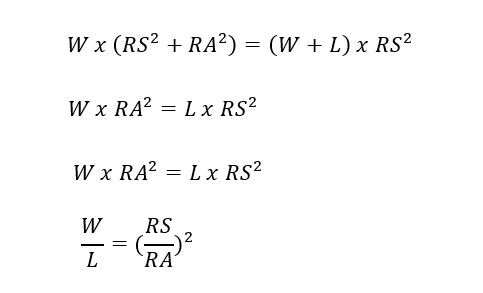
Anyway, substitute “RS” for runs score and “RA” for runs allowed, and unpack “win pct”: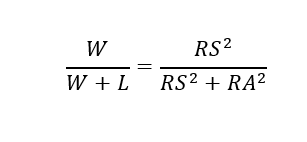 We can get to the desired ratio formulation thereafter with some minor algebraic manipulations:
As you would expect, and can be verified under either rendering of the Pythagoras expectation, when a team allows as man runs as it scores, its winning pct is .500, which means W/L=1.
Horowitz proposed that we consider this formula,
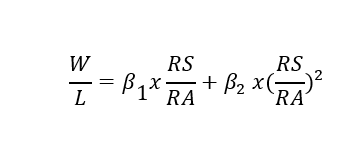
when RS = RA. Because we know that in that circumstance a team’s Pythagorean expectation win. pct = .500–W/L =1 — should expect β2 = 1 — because that’s what the ratio formulation of the Pythagorean expectation dictates—and that therefore β1 = 0. Accordingly, β1 + β2 = 1. That sum is Horowitz’s PH.
Now imagine that we fit a regression model to a manager’s career record, treating each season as a separate observation, and found . . . PH > 1! According to Horowitz, that would mean a manager’s skill had bent the Pythagorean-expectation curve, generating an expected win pct greater than .500 in seasons in which his team allows as many runs as his team scores! By the same token if PH < 1, then the manager’s ineptitude was dooming his team to a losing record despite scoring just as many runs as its opponents.
Horowitz applied his formula to a group of high-profile managers and came up with these values:
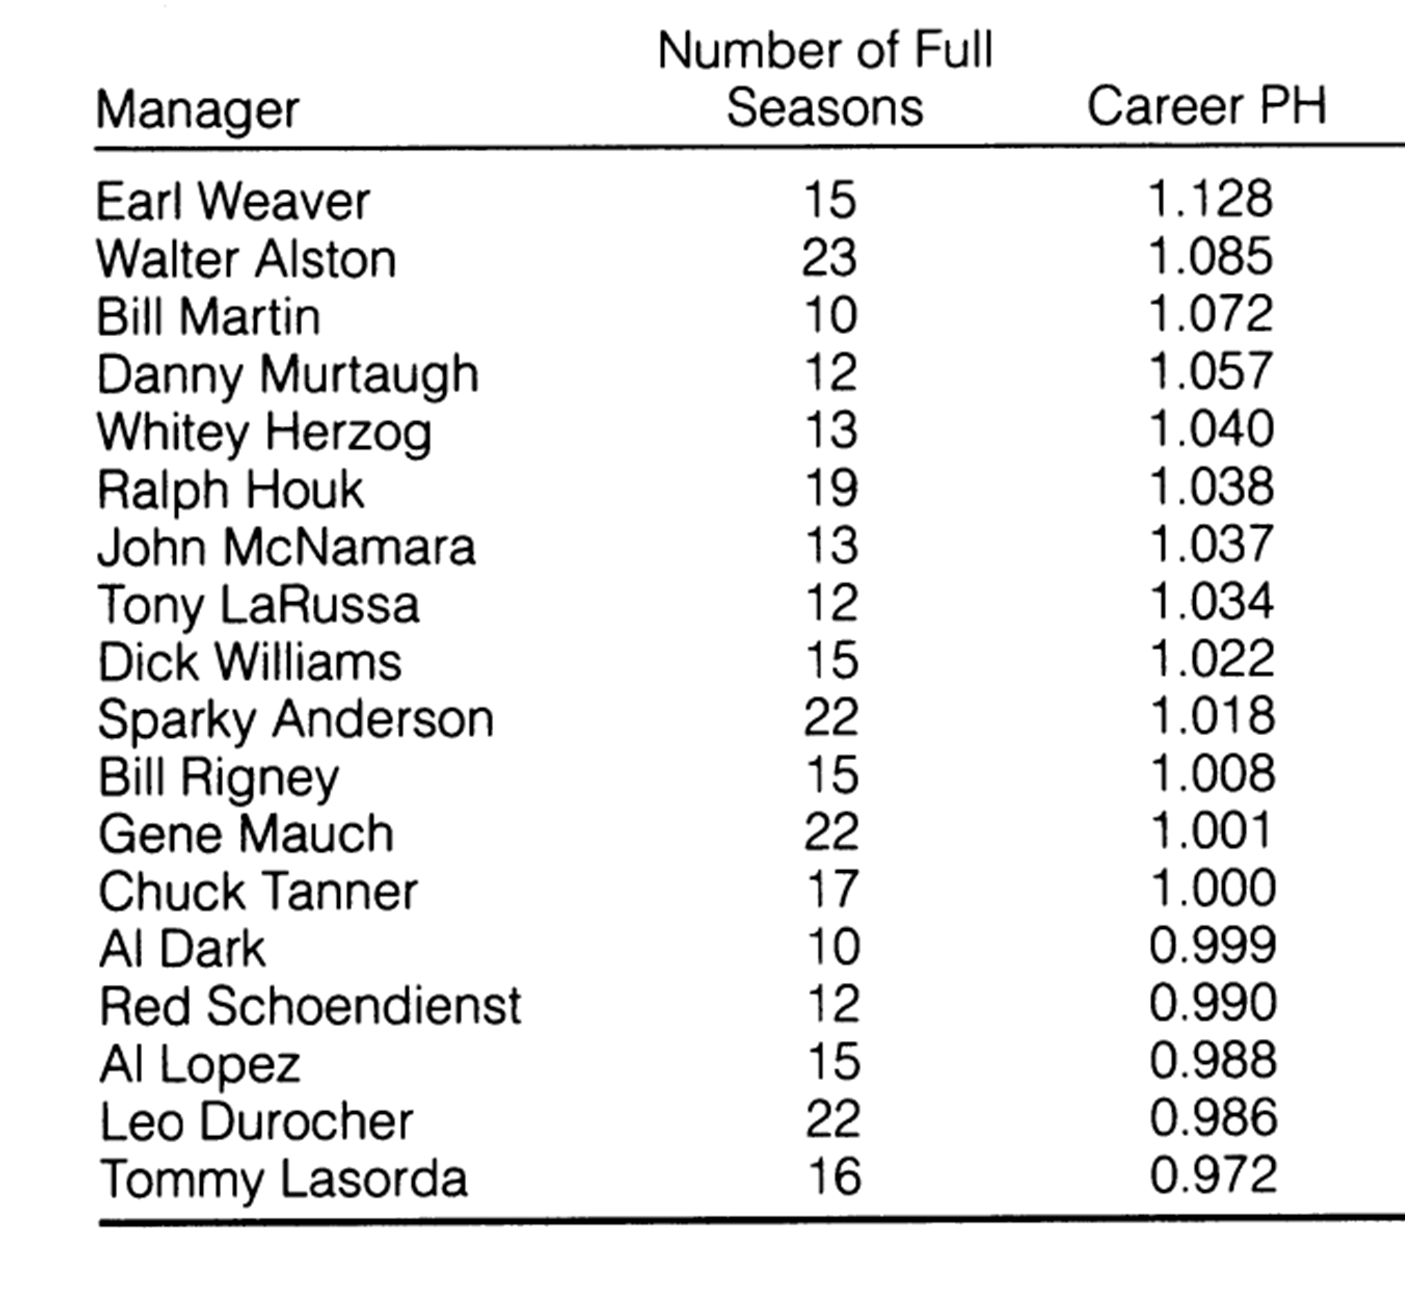 Here’s how you interpret PH: it’s an odds multiplier. When a team allows as many runs as it scores, it’s odds of winning should be 1:1. But because Earl Weaver, e.g., has a Horowitz’s PH of 1.13, a team that scores as many runs on average as its opponents will, when managed by Weaver, be 1.13:1 favorite. That works out to a winning percentage of .530, as opposed to .500.
That same team managed by Tommy Lasorda, in contrast, would be a 0.97:1 underdog every game, and end up with a seasons end win. pct. .490.
So is Horowitz’s PH valid?
Well, a group of sharp-shooter econometricians–Ruggiero, Handle, Ruggiero and Knowles–argued forcefully that it isn’t. Basically, according to RHRK, the Pythagorean expectation formula is essentially analytic. That is, it’s just a sort of mathematical truism that reflects the way that wins and losses pile up when runs scored and runs allowed are normally distributed across games.
 Of course, runs scored and runs allowed are going to occur in irregular patterns over finite samples; that’s why Pythagorean expectation doesn’t perfectly explain team wins and losses in a season (it usually explains about 90% of the variance in team W/L records). So if PH ≠1, that just means that over the course of a manger’s career, the distribution of runs scored and runs allowed was either a lot smoother than normal (PH > 1, because no runs scored were “wasted”) or more lopsided than normal (PH < 1; “blowouts” squandered runs that should have been saved for later contests where they’d mean more)–all as a result of chance, not managerial skill
Horowitz fired off an angry reply, of course. And, well, that was that.
Now I think I could work through the math and figure out who—Horowitz or RHRK—was right, but it would take approximately 900 years. However, I know a shortcut that will allow me to learn all I need to know to settle this dispute in about that many seconds: MC-MPS— or Monte Carlo Monkeys Playing Strat-o-Matic!
Using Retrosheet, I compiled the score of every game managed by every AL or NL manager who occupied the skipper role in ≥ 1,000 games. I (or my computer) then calculated the mean number of runs scored and allowed and the standard deviations thereof, per game in every individual season, for each of these managers. Finally, I simulated every one of these manager’s games over his entire career 1,000 times, randomly generating runs scored and against consistent with those means and SDs.
MC-MPS creates the world we could be expected to see if game outcomes for these managers had in fact been determined sheerly by chance and without the influence of any manager skill (I limited participation in MC-MPS to monkeys who had spent their lives pounding randomly on typewriters in an attempt to reproduce the works of Shakespeare, so none would have any clue about baseball strategy). Basically, we want to see if the world we observe could possibly have arisen from chance—the output of skill-free monkey managers.
Start with my own reconstruction of the world we observe.
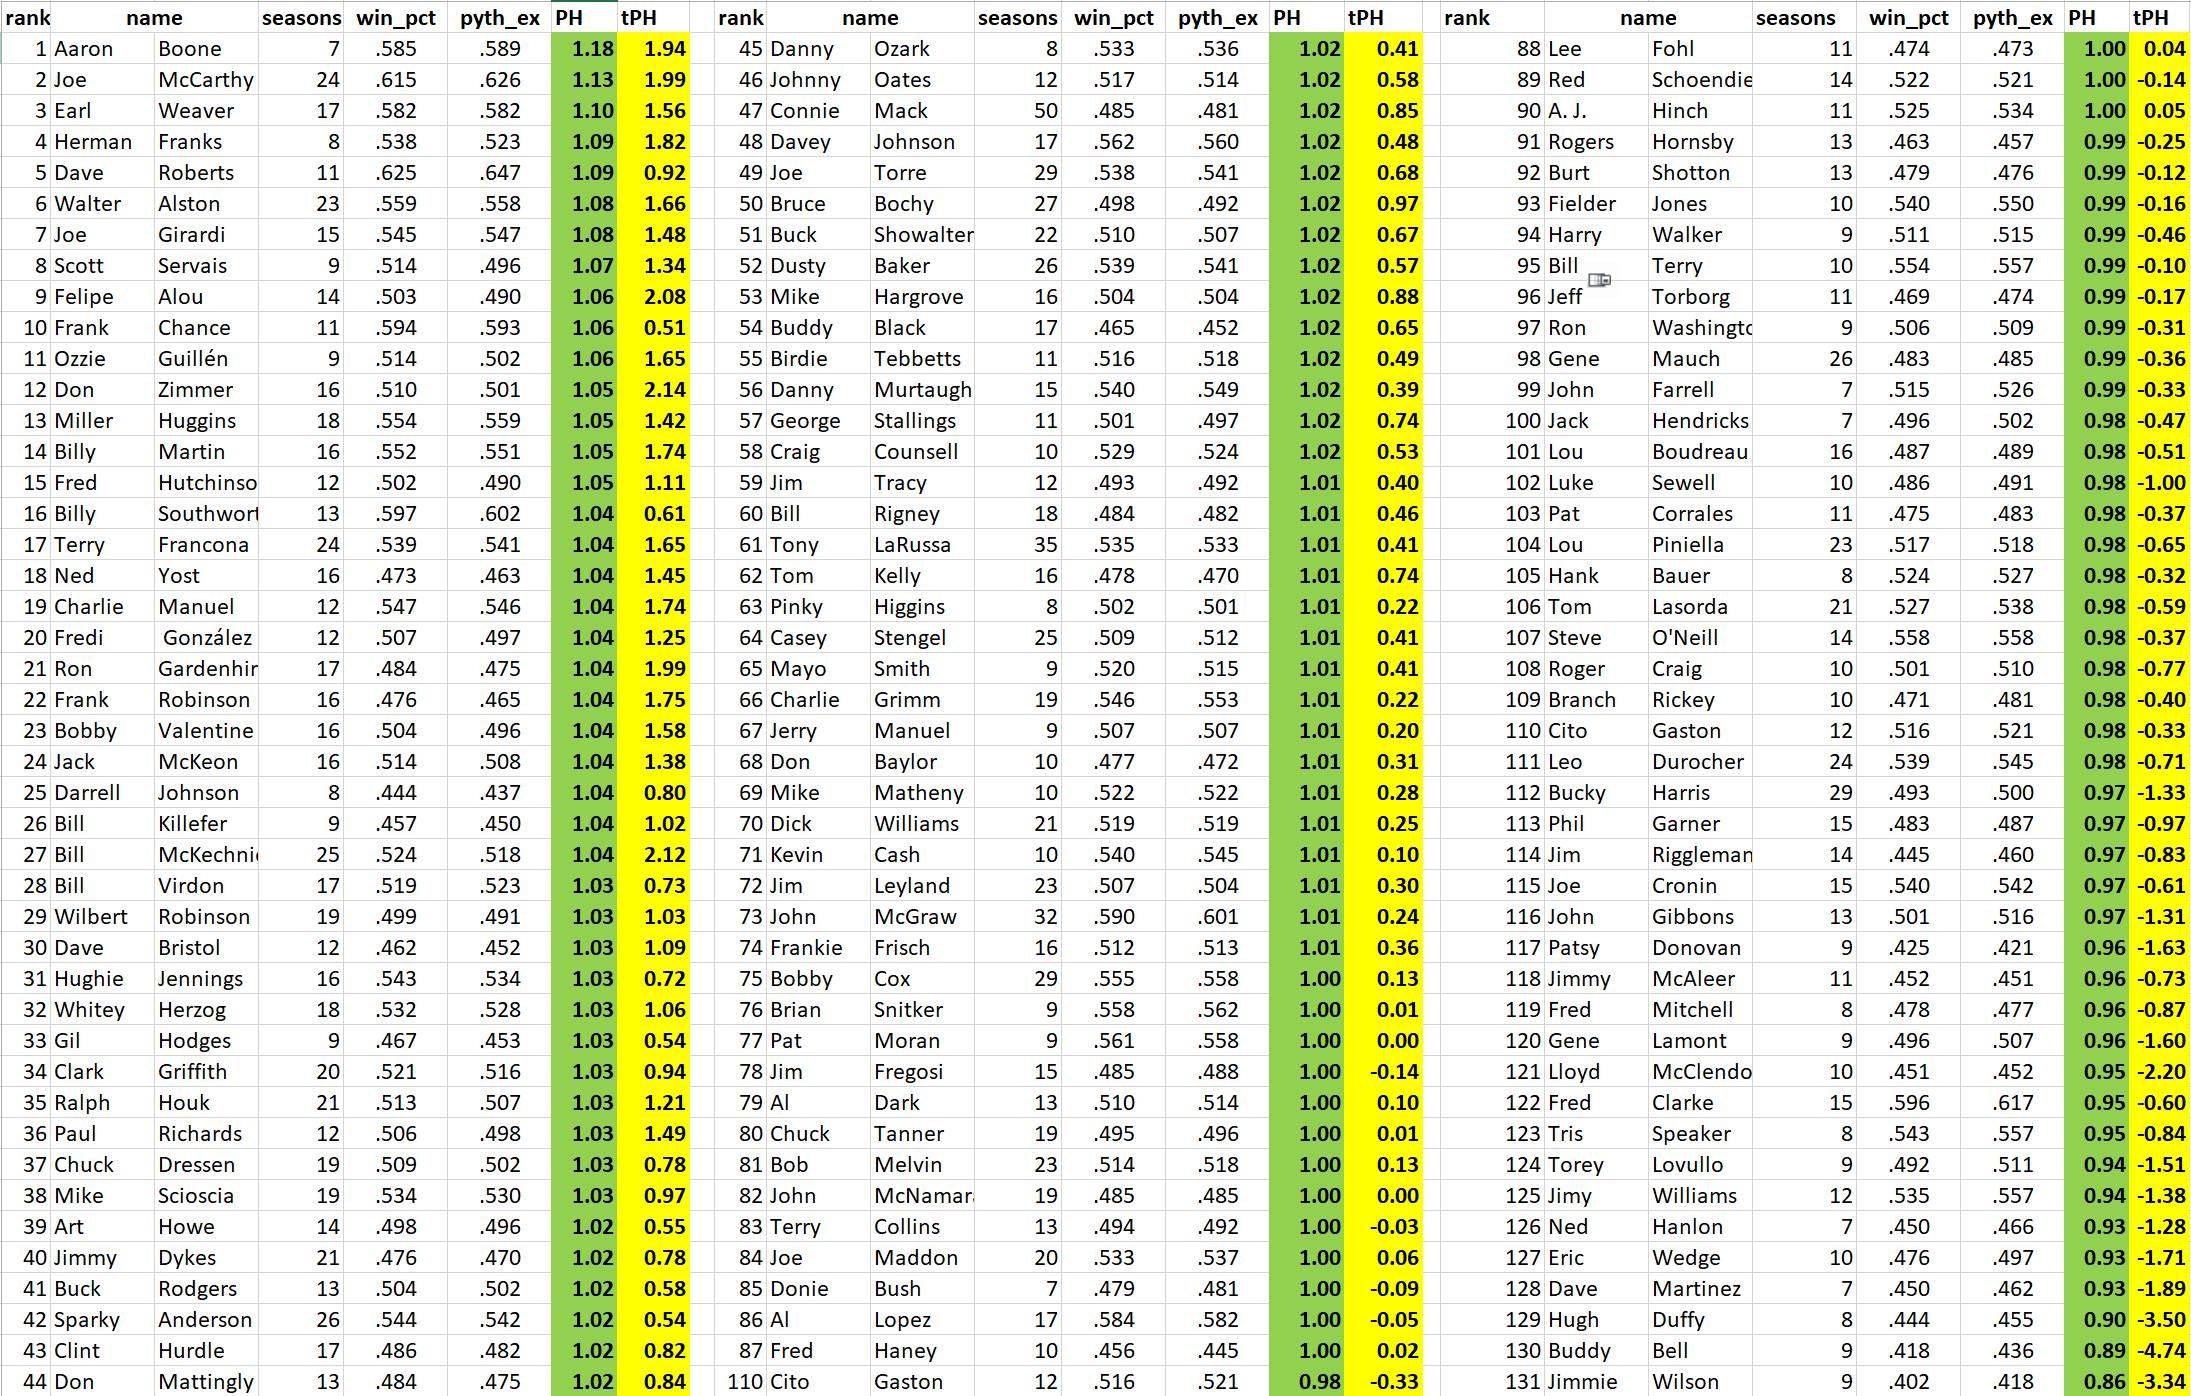
My replication of Horowitz’s analysis includes more managers. Otherwise, my numbers are very close to his, likely varying to a small degree because with access to Retrosheet game reports my data were a bit more complete.
Note that about 74 of the 131 managers have Horowitz PH’s > 1 and 40 PH < 1. Okay.
But look at the t-statistics. Those tell us, basically, how many SDs above or below the PH mean each manager was (actually standard errors above/below; PH estimates are means).
Only 5 of the PH > 1 managers had t-statistics > 1.96, and only 4 PH < 1 t-statistics < -1.96. That’s the traditional “p ≤ 0.05” cutoff.
What can we infer from that? Well, if we did 131 trials of a random process that generates a positive result 5% of the time, we’d expect 9 positive outcomes 21% of the time. In itself, that makes me think that the observed results aren’t especially unlikely to have occurred by chance.
 But how about the MC-MPS world? The 131,000 monkey-managed seasons (1,000 per manager) actually furnish us a better view of what randomness looks like in our problem than do the premises of the “p < 0.05” rule. The conventional picture of statistical significance assumes that the class of events being examined have a normal distribution. But in reality, the random process in question might not be normal. The simulation, if it has captured the key parameters (here game run-scoring distributions) generates for the variable in question (Horowitz’s PH) a picture of random distribution that’s potentially more faithful to reality than the one we get from using conventional sampling assumptions.
So . . . Across the 1,000 replicated careers of all the featured managers, their monkey stand-ins had a mean of 9 (± 0.2) managers with “significant” PH ≠ 1.
If we stopped right there, I think one might reasonably conclude our world is actually just the planet of the manager apes. Or at least can’t be reasonably distinguished from it. The monkey’s playing 131,000 seasons of Strat-o-Matic reproduced exactly the real-world number of managers who “beat Pythagoras”—or failed even to clear the Pythagorean expectation bar—across their careers.
Thus one might see the MC-MPS experiment as furnishing evidence in favor of RHRK’s argument that Horowitz’s test generates nothing distinct from what we’d observe as a consequence of chance deviations from the normal (as in truly normal for this phenomenon) distributions of runs scored and runs allowed.
Or at least that was my initial conclusion.
But we’re actually not done yet! If we really want to peel back all the layers of our monkey manager’s banana peels, we’re going to have to ditch all these t-’s and p’s and enter . . . Bayesball land!
Stay tuned!