I received the benefit of a very generous and profitable consultation with the world’s greatest expert on how to measure and interpret performance spreads in baseball. And there is good news and even better news.
The good news is that he helped me overcome a mistake that was distorting my analysis of the Gould conjecture. For reasons that I won’t bore you with, I had figured that changes in the mean of a performance metric didn’t supply a reason to anticipate any divergence from Gould’s expectation of declining standard deviations. That’s not right, especially where the mean displays a persistent increase over a period of time, which often generates a corresponding increase in the SD. (It’s obviously still fine, though, to use season-specific z-scores to compare performances over time; z-scores are by design indifferent to changes in means and SDs).
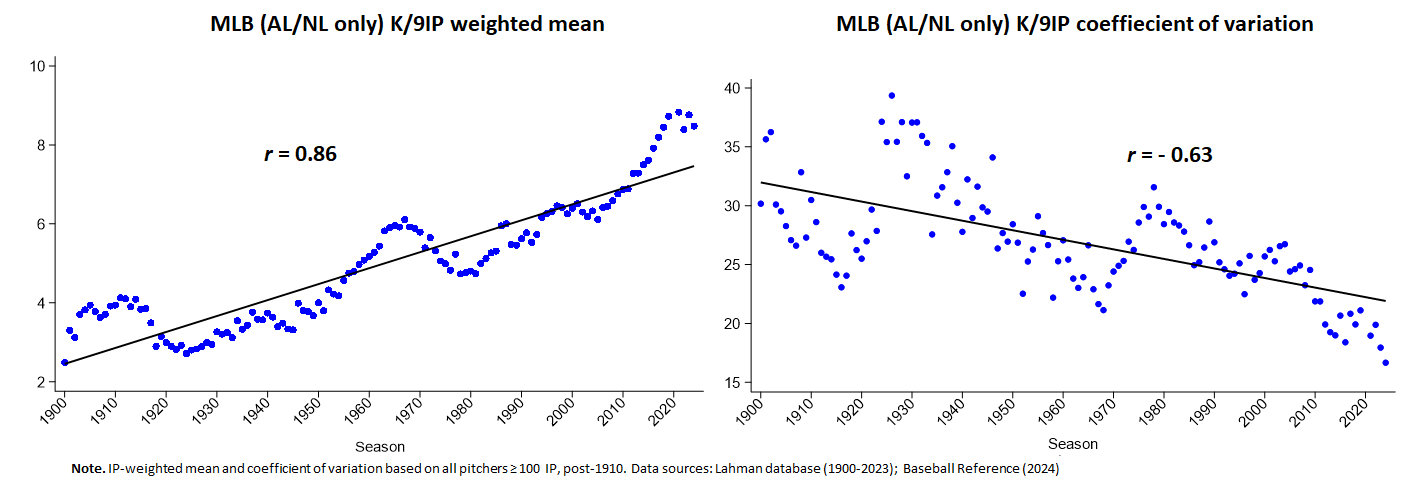
To adjust for the inflating effect of an increasing mean, the trend in SDs should be evaluated with the coefficient of variation, which essentially standardizes SDs over distributions with diverse units. The coefficient of variation is calculated by dividing the standard deviation by the mean and multiplying that quantity by 100, generating, essentially, a percentage representation of the variance associated with the a distribution’s SD. As such, it makes dispersion of values within diverse distributions unit invariant.
Using it erases most of the anomalous results I had been observing. Take a look at K/9IP, e.g.
Or HR/9IP
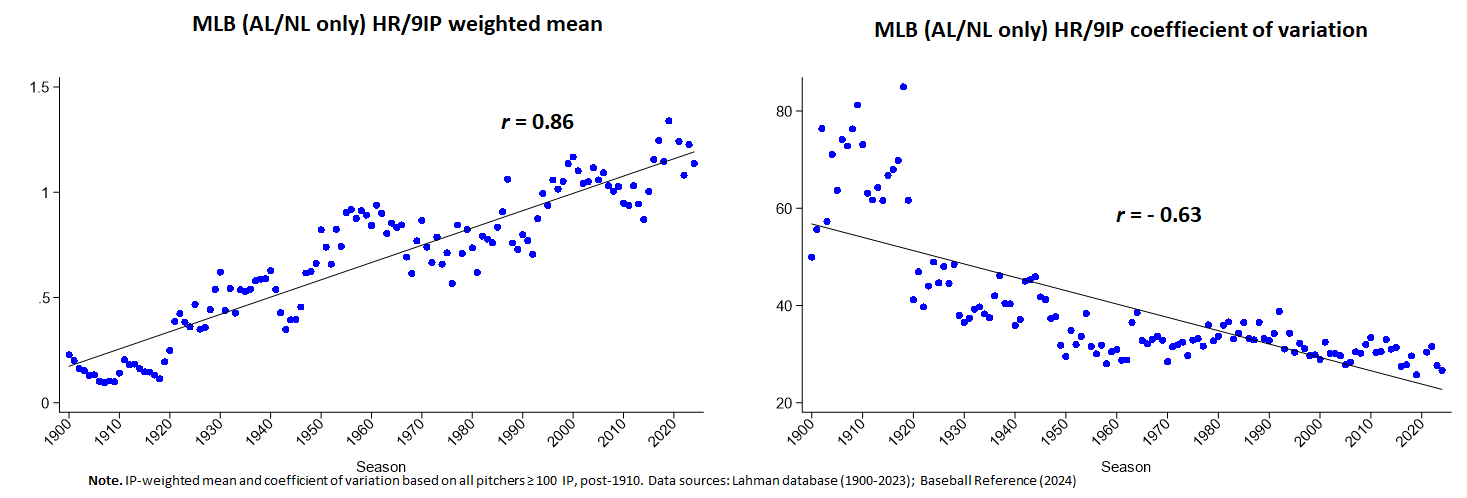
Phew, the spooky weirdness has been exorcised!
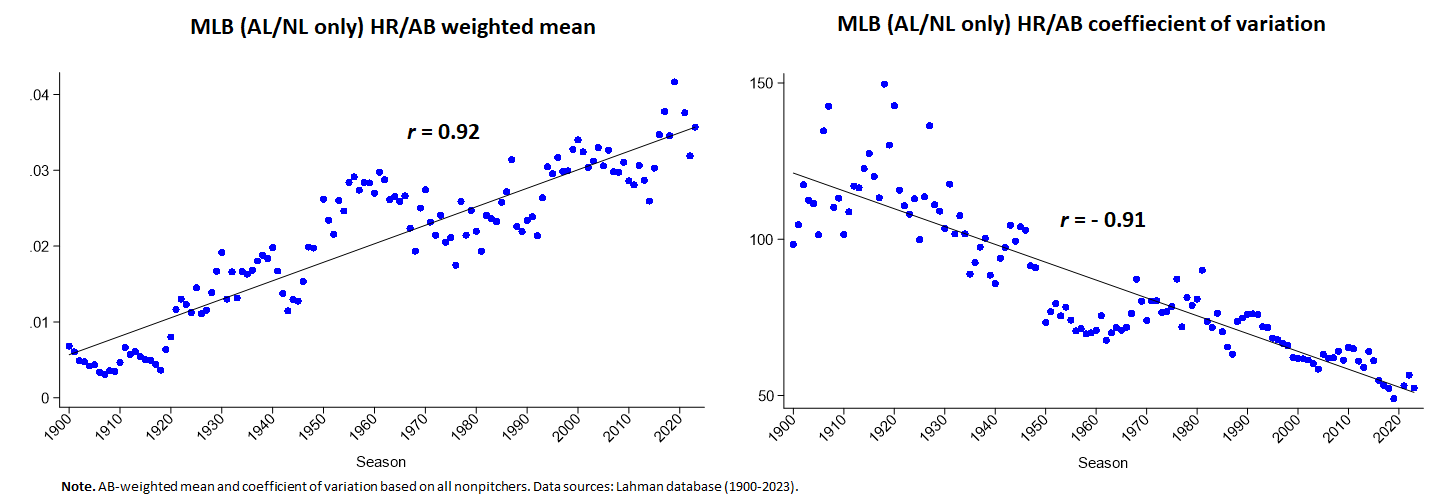
Lots of Gouldianism, too, in offensive metrics of performance, in addition to batting average where the conjecture started and has always held even without the standardization, as it were, of standard deviations.
But second and even better, while pretty close to what Gould surmised we’d see, there are still interesting deviations, ones that nicely focus and hence revitalize the basic why not question.
The principle example is FIPr:
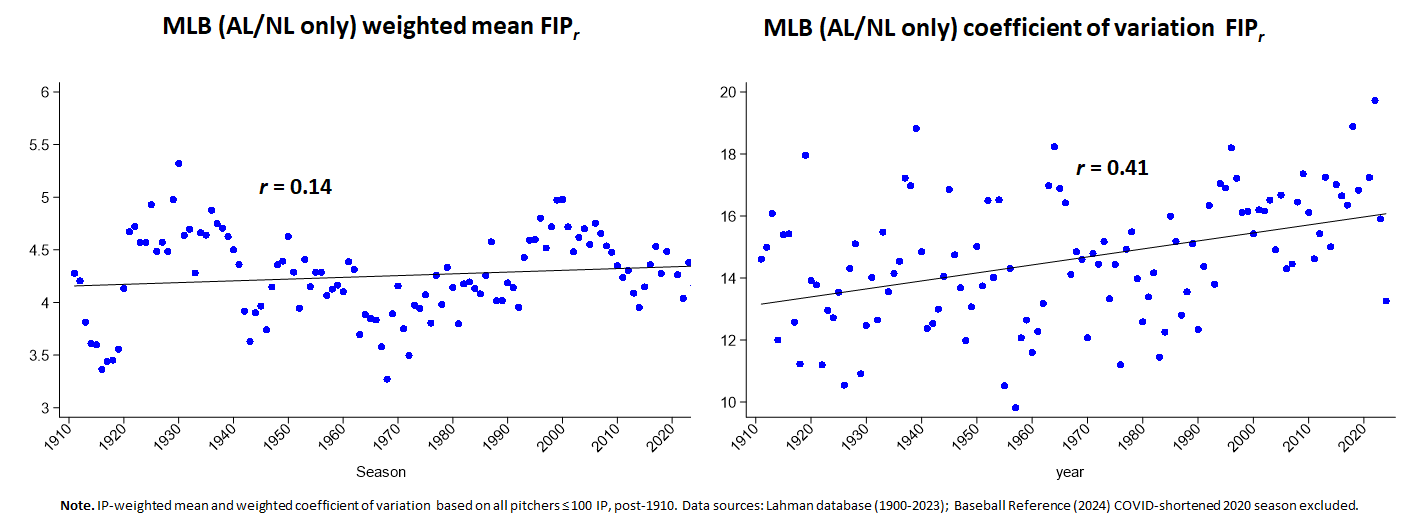
That’s definitely not a Gouldian pattern of steadily declining variance!
If we look even closer, moreover, the uneven nature of the variance pattern is super intriguing. Basically, until around 1990 we see a kind of recurring series of brief surges followed by periods of decline. That could be noise, of course. But insofar as it’s not, it’s also possible that the pattern is remarking periods of change in game dynamics. The 1930s and 1960s, one might surmise, both witnessed the emergence of pitchers who started to dominate by striking out more hitters, a development that then triggered the sort of selection for that trait that brought about Gouldian decline in variance.
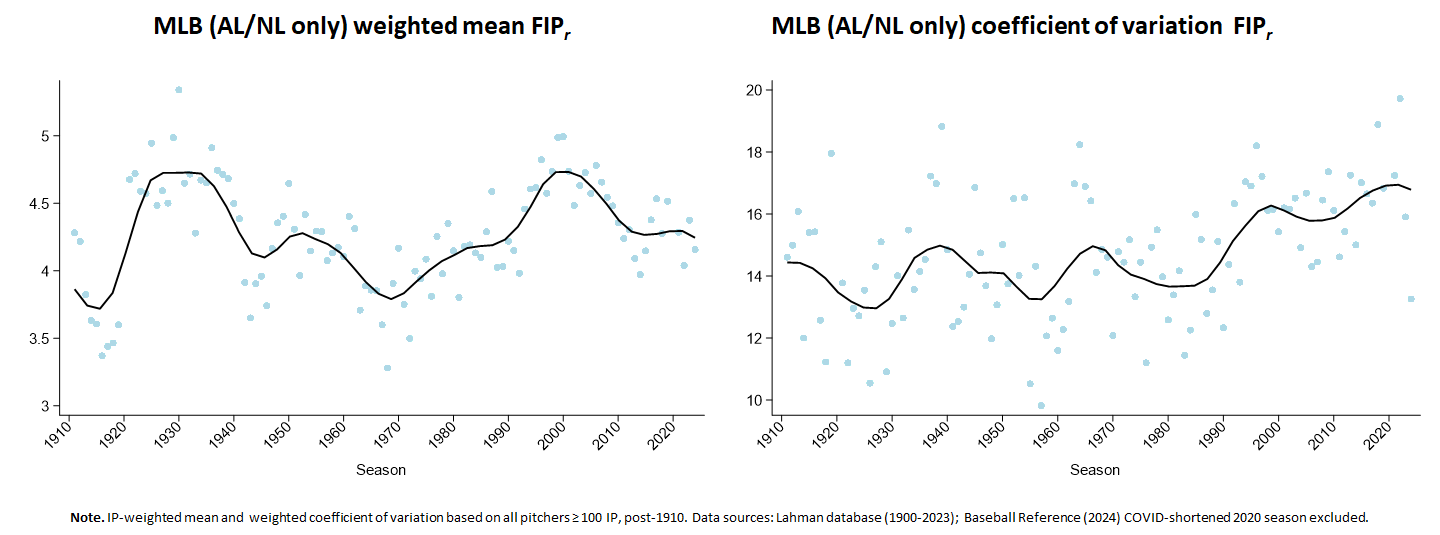
But most important of all, we see a steady, unrelenting, and remarkably long period of increase in variance starting around 1990. That’s where FIP, as a marker of baseball’s Great Transformation, started to rise at an unprecedented rate.
Why hasn’t the sort of talent equilibrium that Gould posits occurred over that entire period?
Is there a signature lag in the contraction of performance spread after a period of evolution in the game?
Or maybe there is some offsetting, anti-competitive force (skinflint owners, e.g., who are happy to experience the status of owning a team but too cheap to pay for success) that defies the selection pressures that Gould imagines?
I’m sure there are other possibilities.
The point is, the correction to the approach I was taking to measuring variability clears the path once more for profitable conjecture and refutation!
Stay tuned. . . .