Having examined the value of the Pythagorean Expectation Formula (PEF) as a benchmark for assessing manger value, I thought it would be interesting to extend the analysis and see if PEF can be used to test the impact of any other aspects of team performance.
One of these is bullpen quality.
But first let’s review.
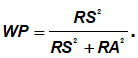
PEF derives winning percentage, of course, from the ratio of runs scored to runs allowed:
Whether a team “beats” or is “beaten” by PEF is solely a function of its run-scoring distribution. Where run scoring is “smoother” than normal, teams “outperform” their PEF projection: runs are naturally “conserved” in that case, and are (in effect) “available” to secure the maximum number of wins in close contests. Where the distribution of runs is “jagged,” runs that could have been used more profitably in 1- or 2-run games are “wasted” in blowouts; teams thus “underperform” relative to PEF.
So the question is whether any particular feature of team composition, like manager quality, can be shown to influence run distribution by enough to propel a team to a record that “exceeds” its PEF projection—and by an amount greater than you’d expect given the chance variation in run scoring distributions across teams.
It’s plausible that managers’ strategic decisionmaking would have that effect. Good managers might pull out more close wins than bad ones do.
But if this is so, it isn’t something that in fact shows up in the deviation of managers from their PEF projected winning percentages.
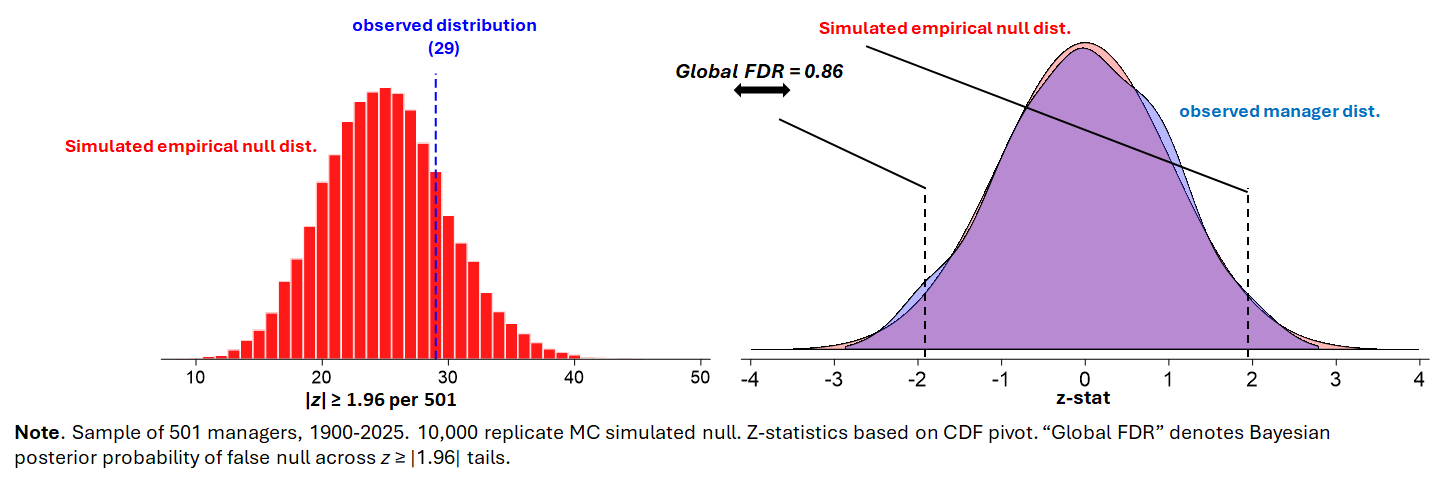
This is what we learn when we use simulation to construct aa “realistic” or “empirical null” benchmark. In this procedure, teams’ games are replayed, drawing randomly from a distribution of runs scored and allowed pegged to their season means for the same. The distribution for the random draws, however, is not the ones experienced by those teams but rather the league standard deviation. Teams thus score and allow the expected number of runs, but they do so consistent with a distribution that is necessarily disconnected from any impact their managers could have had on wins and losses in close games.
When we compare, oh, 20,000 null season records to the teams’ actual records, we see only a trifling probability that any is beating or is being beaten by PEF to a degree that exceeds what we’d expect to see by chance alone.
I don’t think we can infer that managers don’t matter. Indeed, the mWAR Estimator suggests that they clearly do. Instead, I think we should be skeptical that PEF is a valid benchmark: it’s more likely that PEF, by accounting very systematically for the impact of run scoring differentials on winning percentage, already absorbs whatever contributions managers might be making to team success. If so, then deviations will be random noise.
But this is a conjecture. So why not do some more testing and see what we find out about PEF as a benchmark of one or another element of team performance?
Some commentators say that bullpen quality also results in deviations from PEF.
The claim again is plausible: better bullpens, and in particular better closers, might help teams to secure excess close wins, which will end up being represented by a smoother, or lower-variance distribution in runs scored (just enough to win those close games).
We can do the same simulated empirical null test. Now we just attribute to team bullpens any difference between teams’ actual and PEF-projected winning percentages. Bullpens can’t actually have affected winning percentages in the simulation, which, again, removes any external influence that can affect variance in a teams’ run-scoring distribution. All we have to do at that point is compare the PEF deviations of real teams—ones that had bullpens that really did make a difference in their teams’ records—with the PEF deviations of the simulated teams and their phantom bullpens.
Bullpen quality, btw, was computed by calculating the expected FIP-derived “runs saved” for the teams relievers generally and their closers in particular. We start with a model that, after subtracting fielding runs saved, relates teams’ runs allowed to their “fielding independent pitching.” We then estimate the number of runs saved by each teams’ relievers generally and closers in particular, relative to the runs a team that an average FIP would have allowed in the innings logged by those groups of pitchers.
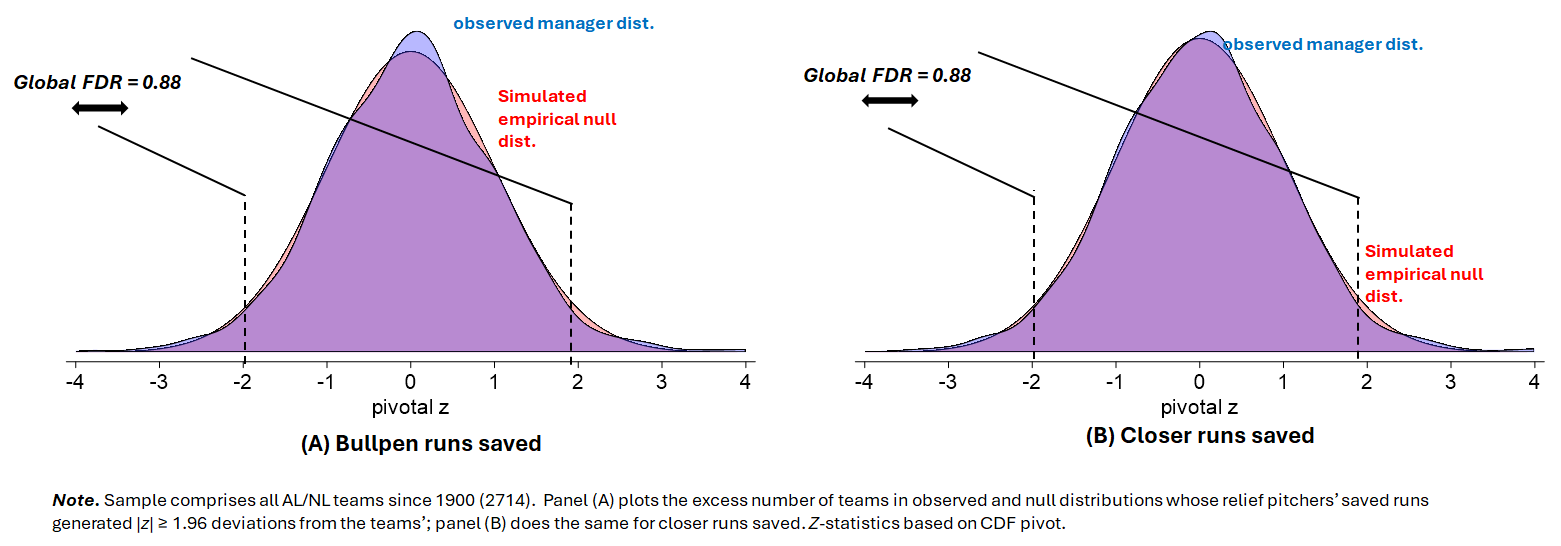
Again, we see that there is no meaningful evidence of any systematic effect. The proportion of “false nulls” is close to 90%; if you want to infer that about 12% of 5%–or 0.6%–of teams deviate from their PEF winning percentages on the basis of their relief pitching, be my guest. I’m pretty sure those who have advanced the “bullpen quality beats Pythagoras” thesis did not have an impact this microscopic in mind.
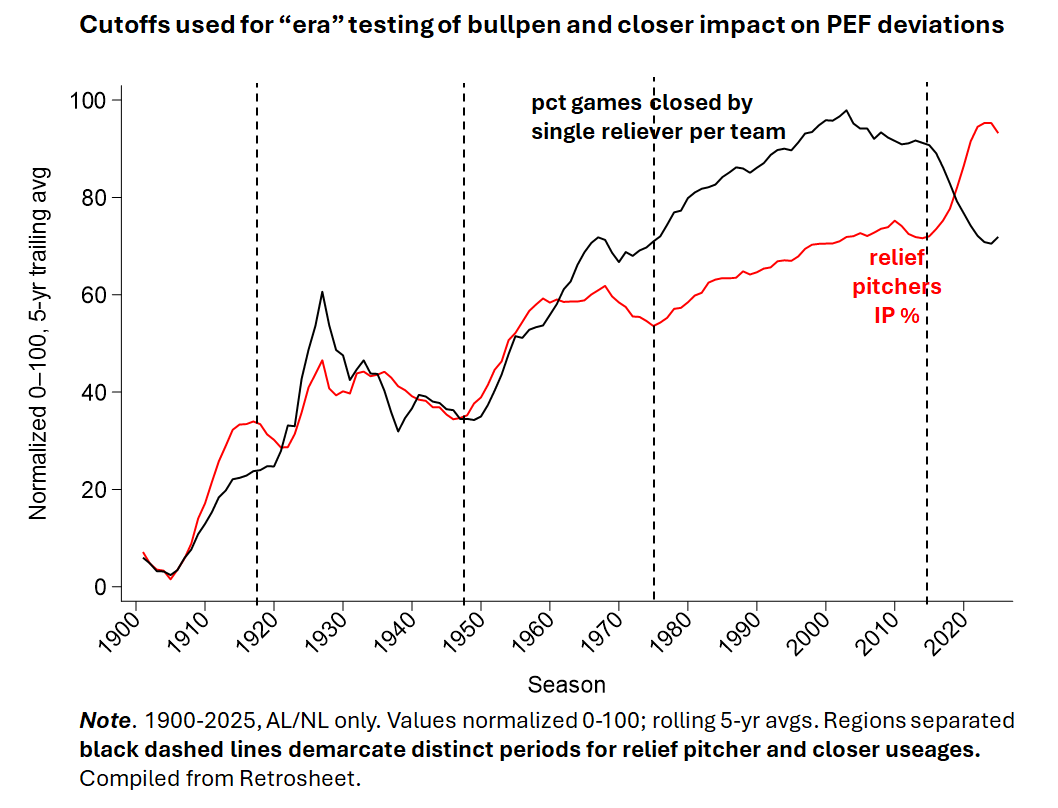
There have, of course, been very significant changes in pitcher usage over time. The tests I’ve just reported were based on all teams from 1900-2025; but because the impact of bullpen quality has almost certainly changed with these shifts in how teams use pitching staffs, it’s necessary to do this test for discrete “pitching eras.”
So I did. Using data showcased in the last post, I came up with 5 distinct bullpen eras based on observable breaks in how teams have used relief pitchers and closers over the course of MLB history. The results—no genuinely meaningful, nonchance effects in relation to PEF projected records—remained unaffected.
Now obviously, bullpen quality does matter for how teams fare. That’s not the issue. What is whether PEF deviation is a valid test of how much they matter.
The answer is unambiguously no.
So why have some commentators purported to find otherwise?
My guess is that they didn’t possess an accurate understanding of what we’d have to actually see to recognize genuine PEF deviations. They did a simple “significance” test untethered to an empirical null—which is what shows us what genuine randomness for PEF looks like.
And then they compounded this problem by neglecting to account for the frequency with which deviations from any specified level of “significance” would occur by chance given the sheer number of teams whose records are being examined.
Laying bullpen quality and managerial acumen to rest, there remain plenty of additional claims out there that PEF deviations can be connected to one or another aspect of team performance.
We’ll get to some of those too presently….