The short answer is yes. For the longer answer that makes the case—read on.
This post is a successor to the one on who had the highest-ever single-season batting average. I’m now using the same methods to determine the highest single-season OPSs.
First propounded by John Thorn and Pete Palmer in 1984, OPS (On Base Percentage plus Slugging) remains the single best predictor of run production at the team level.
As one can readily see, league-wide OPSs, like league-wide BAs, have jumped around over time. That means one can’t use the raw value of OPS (or BA) to rank the quality of the performances that this metric measures: variability rooted in changing game conditions, rather than fluctuations in batters’ skills, make direct comparisons of that sort unreliable.
As explained in the post on batting averages, standardization is a statistical technique for dispelling the effects of extraneous variability. It puts on the same scale normally distributed sets of values that one has reason to believe are measuring the same thing but that vary in their means and standard deviations. College standardized entrance exams are like that. So are batting averages and OPSs.
. It transforms values from a normal distribution into ones that reflect how many standard deviations they are above or below the distribution’s mean, a meaure conventionally known as a z-score. Z-scores puts values from diverse distributions on a common scale.
So I standardized the OPSs of all NL and AL hitters for every season since 1900 (I hope to replicate this analysis with Negro League players, who aren’t currently included in the Lahman database, my principal stats source). I applied to the OPSs for each season the same sort of computations I used to standardize season-by-season batting averages. I I erformance of all hitters, I transformed Just as I had done previously for season-specific batting averages, I computed the weighted means and weighted standard deviations of OPSs for all batters (excluded only pitchers, whose anemic hitting misleadingly deflates the mean and inflates the standard deviations of hitting performances in pre-DH seasons; and notorious late-1990s/early-2000s steroid users, whose freakishly enhanced performances don’t admit of any interesting comparison with those of yesterday’s greats or today’s. I then converted the OPS of every hitter with enough plate appearances to qualify for a batting title into a z-score, which reflects a variability-invariant measure of the magnitude of his performance relative to that of the mean hitter of the season in question.
Because most fans are unlikely to have an intuitive grasp of z-scores, I normalized these standardized OPSs to a scale centered on 100. The resulting values are akin to ones associated with the more familiar OPS+, a season-normalized measure that is quite useful but that still ignores the season-to-season variance reflected in fluctuating standard deviations (a barrier to genuine statistical commensurability addressed in Michael Schell’s epic works, Baseball’s All-Time Best Hitters (1999) and Baseball’s All-Time Greatest Sluggers (2005)). In fact, let’s call the resulting metric “standardized OPS+” or “sOPS+.”
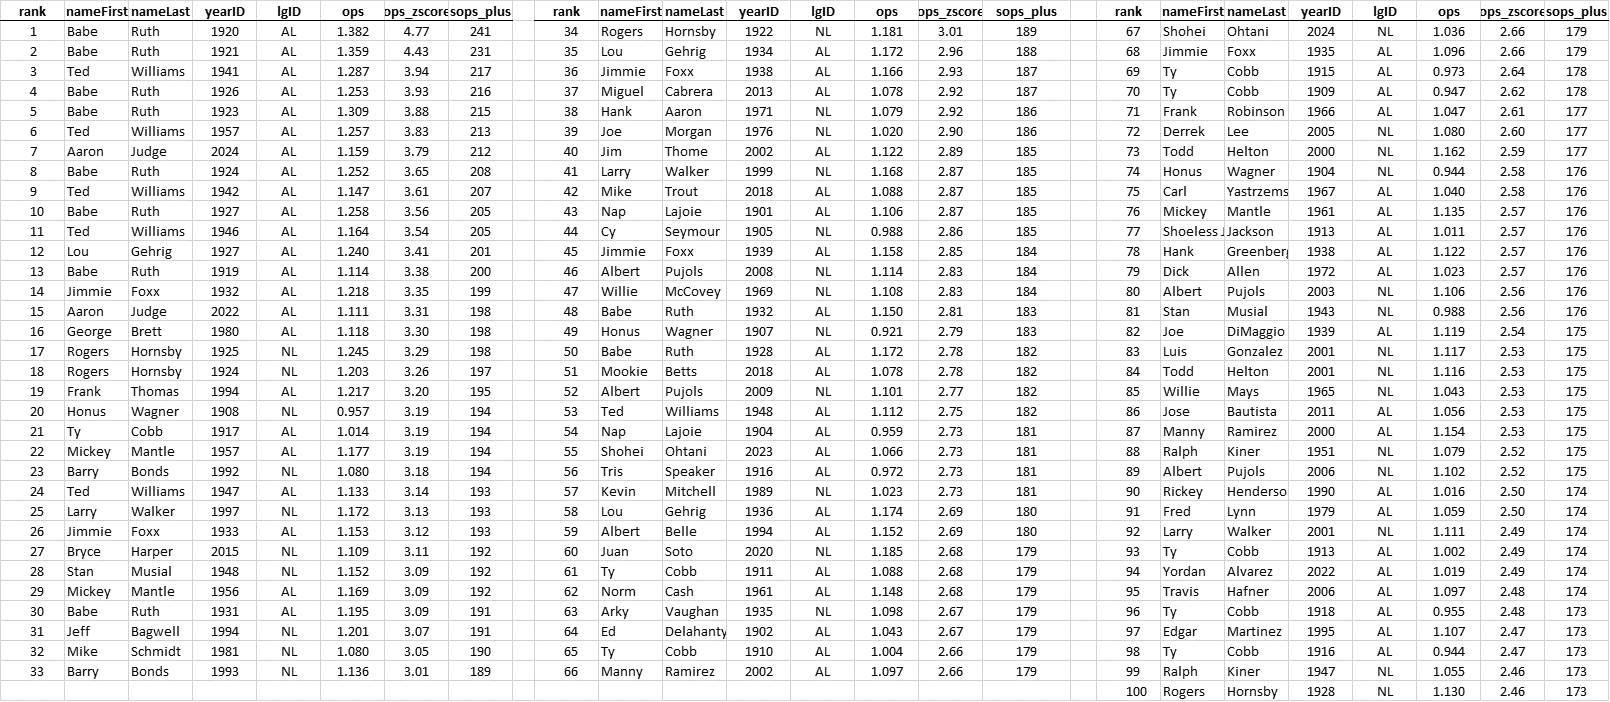
Here are the top 100 single-season (AL/NL) sOPS+ performances of all time.
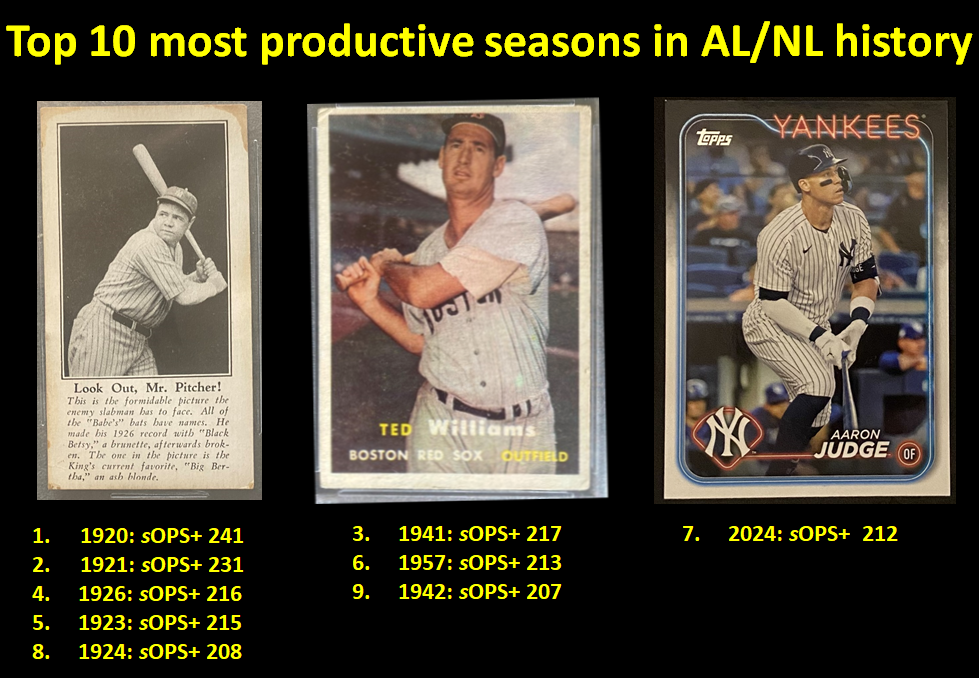
The first thing that stands out is the dominance of Babe Ruth and Ted Williams. They have 9 of the top ten sOPS+ marks of all time (Ruth 6, Williams 3).
But Judge is the other guy in the top 10. His 212 sOPS+ this past season is 7th all time. His unstandardized 1.159 OPS ranks only 31st in AL/NL history. So as amazing a year as everyone knows Judge just had, without the clarifying effect of standardization, the stratospheric heights he reached this season could still evade detection.
His 2024 mark is higher than his own 198 sOPS+ in 2022. That’s impressive not just because Judge hit 62 home runs in 2022, but also because his remarkable performance that season ranked 15th all time!
Babe Ruth, of course, had a monumentally great season in 1927: 60 home runs, .356 BA, and 137 RBIs! Yet his 208 sOPS+ that season is behind Judge’s (truly astonishing) 2024 mark.
Anyone who, like me!, hadn’t yet recognized how privileged we are to be watching a player of this skill perform should after Judge’s production is, by these means, made directly comparable to those of baseball’s greatest all-time sluggers.
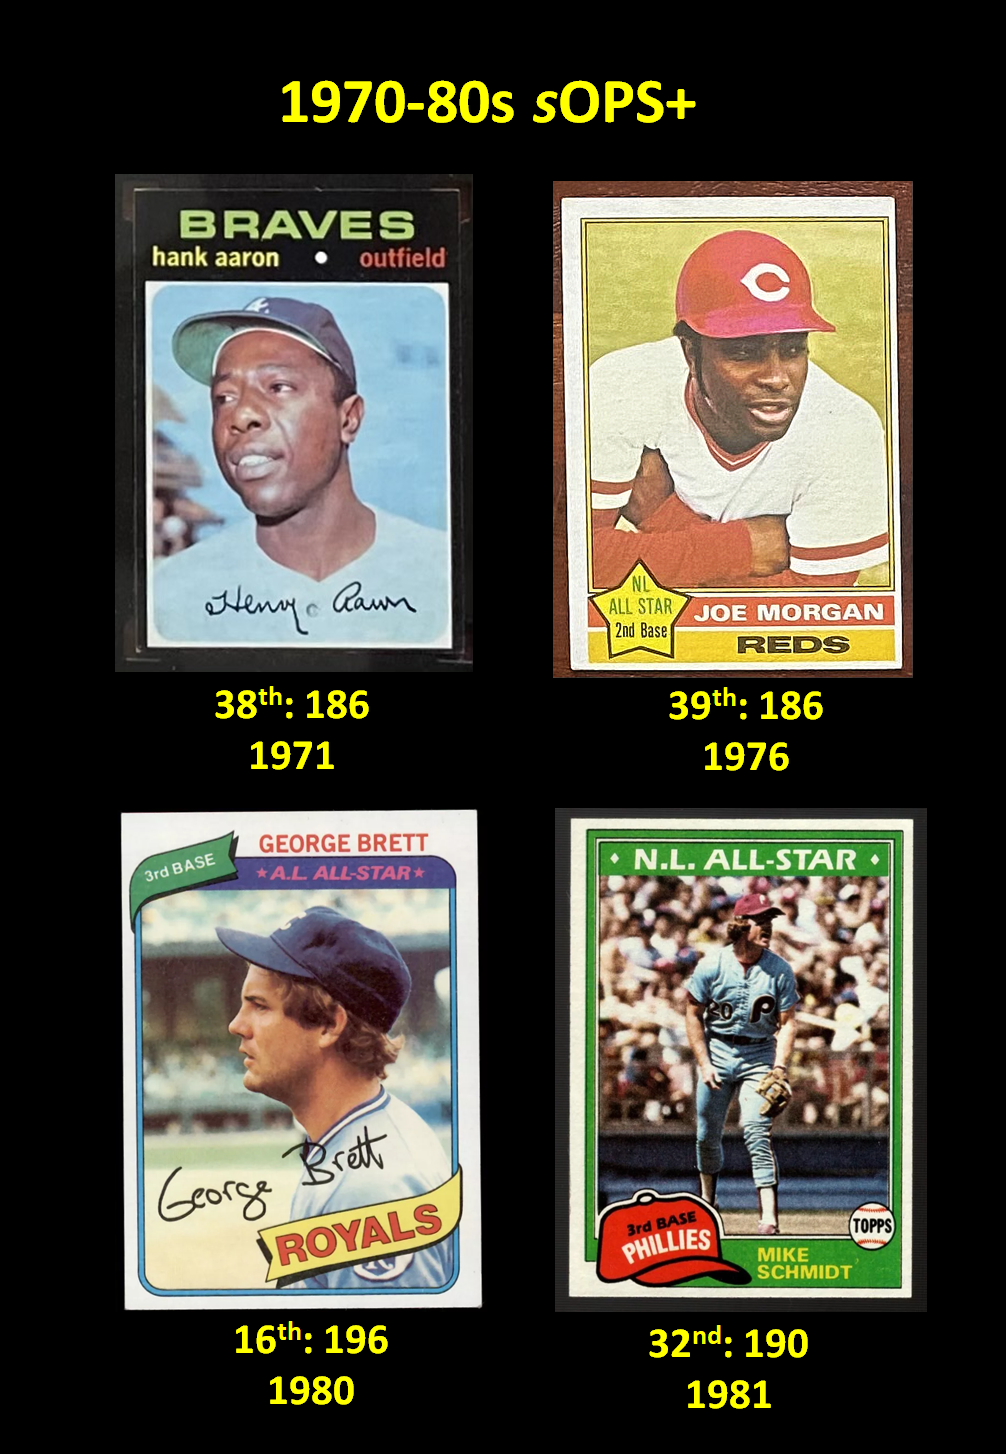
Standardizing OPSs reveals other things too. Effectively tied with Judge for 15th all-time on the sOPS+ list is George Brett in 1980. Brett’s .390 is the highest standardized batting average (BA+) ever! That he combined this sort of consistent hitting at the plate with the production reflected in his 198 sOPS+ (a high BA by no means assures a high OPS) makes his 1980 season all the more historic. (But even more impressive: Williams, virtually tied with Brett atop the standardized batting average list for his .401 in 1941, notched the third highest ever single-season sOPS+ in that same campaign.)
There are a number of all-time sOPS+ leaders from this century in addition to Judge. They include Bryce Harper (sOPS+ 192 in 2015: 27th best ever); Miguel Cabrera (187, 2013: 37th); the effectively deadlocked duo of Jim Thome (185, 2002: 40th) and Mike Trout (185, 2018: 42nd); and Albert Pujols (184, 2008: 46th).
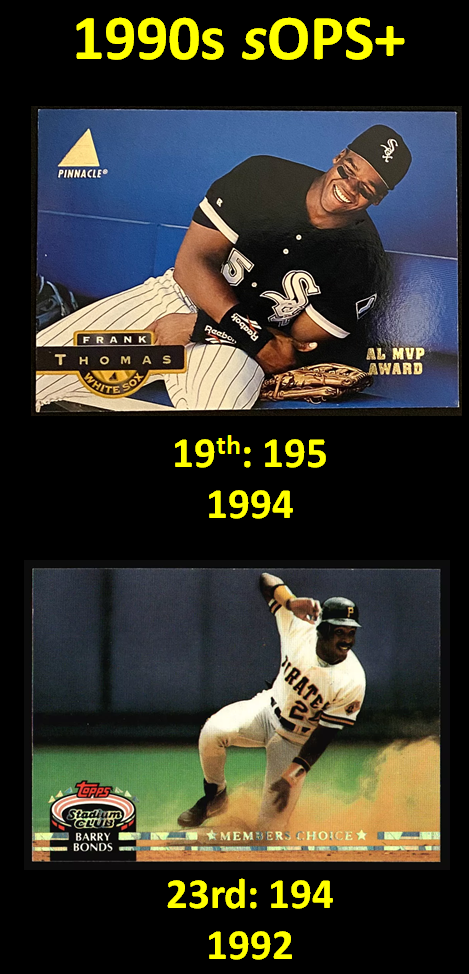
 In the 1990s, Frank Thomas cracked the top 20 (198, 1994; 19th all time). And the deservedly admired pre-steroidal Barry Bonds had two top 50 performances (194, 1992: 23rd; 189, 1993: 33rd).
Mike Schmidt, preeminent slugger of the ’80s, recorded an sOPS+ of 190, 32nd all time, in 1981. I sort of expected him to rate higher.
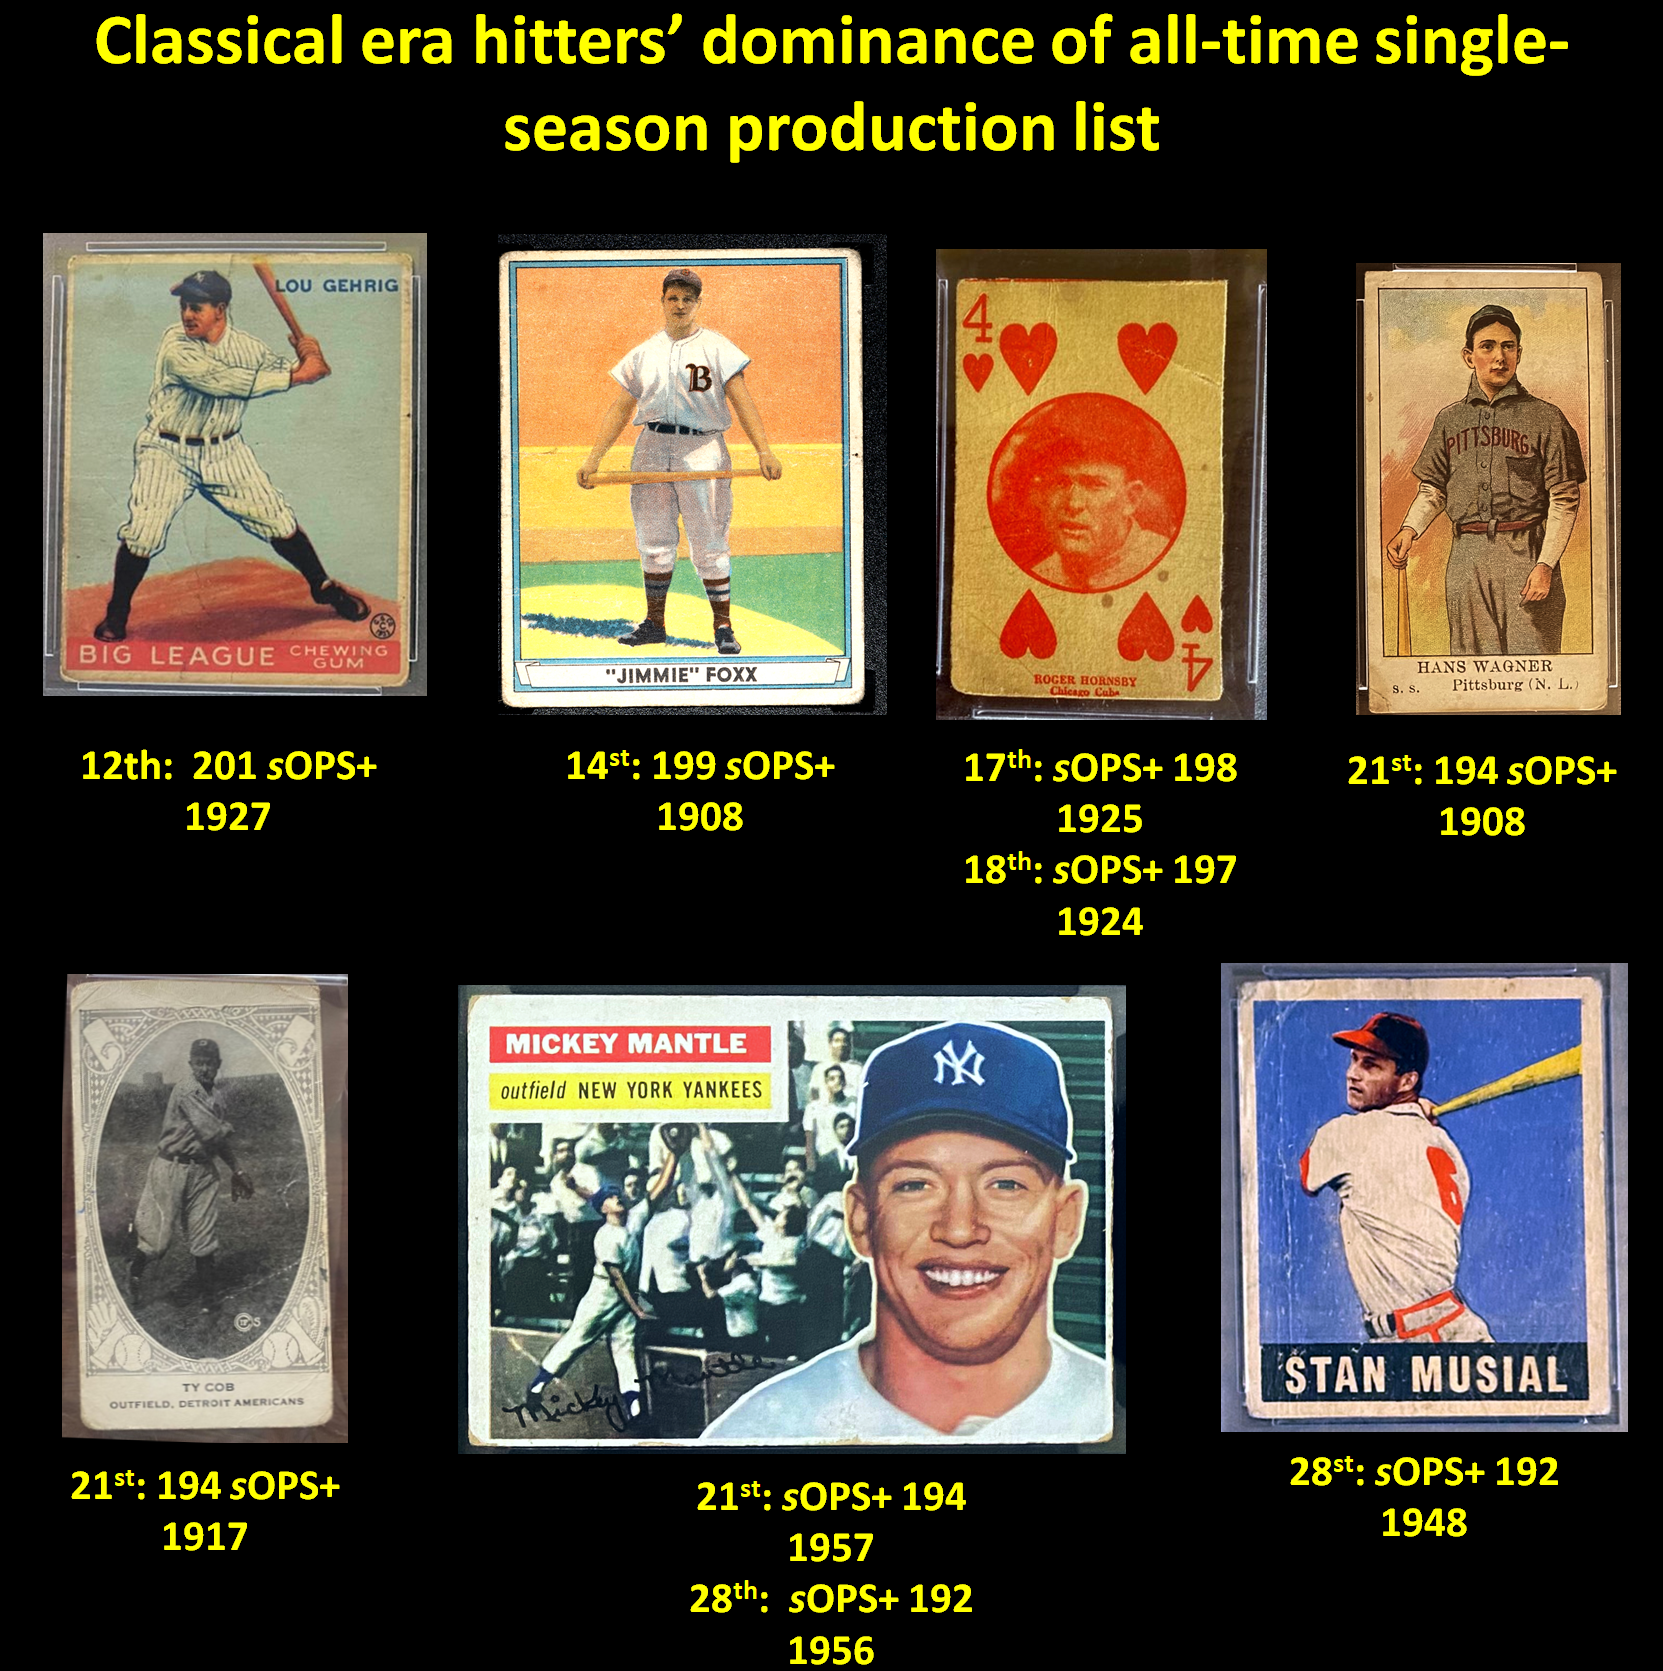
But of course, many of the game’s classic all-time greats see their status vindicated by this measure, too. Jimmie Foxx’s 1932 199 sOPS+ ranks 14th best of all time, and his 1933 sOPS+ 193, 26th. Lou Gehrig’s 1927 season was comparable to Ruth’s—201 sOPS+ (12th best all time). Rogers Hornsby achieved both the 17th highest and 18th highest marks of all time (198 and 197) with his 1925 and 1924 sOPS+s, respectively.
Honus Wagner (1908) and Ty Cobb (1917) both clock in at 194 sOPS+, effectively tied for 20th.
Mickey Mantle has two top 30 sOPS+ finishes: 194 in 1957, good for 22nd; and 192 in 1956, which matched Stan Musial’s score in 1948, and was good for 29th all time.
Hank Aaron’s most productive season came in 1971: 186 sOPS+ (38th best all time).
Hey, look at that: Joe Morgan achieved an impressive 186 sOPS+ as well during his 1976 MVP campaign. I didn’t realize just how productive a season he had until now, either.
But do your own explorations for enlightening comparisons. You can download the top 500 sOPS+s, along with the data and the computer script used to generate the scores, in the Stats section (run your own analysis to find out, if you are so inclined, the sOPS+s of post-steroidal Bonds and other PED users).
As a result of this exercise, I really do appreciate Judge even more now.
And I am fortified in my gratitude for baseball’s numbers, which really can help to reveal the timeless beauty of the game.


