 So, I’ve been making good progress in my expedition to empirically test measures of batter runs produced. Here are the highlights, of which there are three.
1. I improved RP_aa–the runs produced above average metric I introduced in the last post.
It is based, you’ll recall, on (a) forming a regression-based estimate of the impact of OPS on runs per plate appearance; (b) using that estimate to determine the number of runs a team with the player’s OPS would be expected to score over his number of plate appearances; and then (c) subtracting the number of runs the team would score over that number of plate appearance if the team had an OPS equal to the league mean.
The improvement was to fix an error I made (one based on using the wrong mean!) in determining the average number of runs per-plate appearance. The error inflated the “aa” portion of RP_aa.
I revised the last post to reflect the correction. The most important change was that the tie between 1921 Ruth and 2024 Judge for highest season standardized RP_aa was broken—in favor of Judge!
2. I did the work necessary to fully validate RP_aa.
That is, I aggregated for every team between 1900 and 2024 its players’ individual OPS-predicted runs produced (the before “aa” part; let’s call it OPS_RP), properly allocating the results of players who played for multiple teams in the seasons in question. I then compared the number of runs predicted in this manner for every team to the actual number of runs that team scored.
The two lined up wonderfully. Regressing actual team runs on aggregated player predicted runs generated an overall R2 of 0.96. Hard to do better than that! (I have to admit, though, that this is a bit inflated: the model tested the impact of OPS_RP on runs across all teams in all seasons and thus soaks up some between-season variance that’s of no practical interest; a season-by-season model that strips that away would have R20.90!)
I also did a concordance analysis:
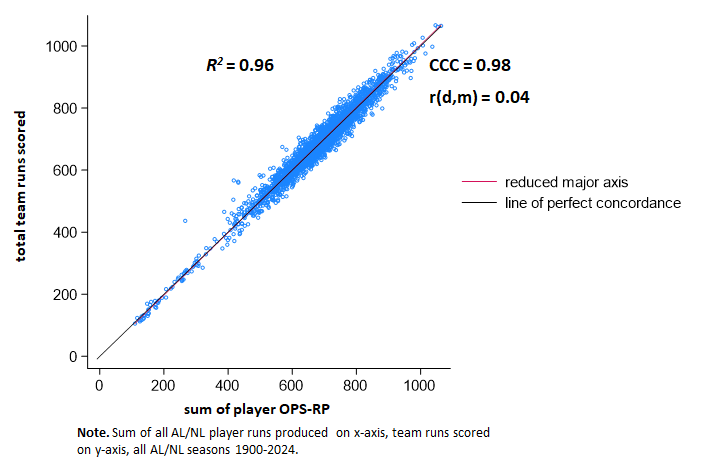
 A Concordance Correlation Coefficient is analogous to an ordinary Pearson’s r, except that in addition to assessing simple covariance it has parameters for assessing absolute agreement of the actual values associated with two continuous measures. Its goal is to determine the degree to which the two sets of measures are genuinely interchangeable. If such interchangeability matters, some commentators will tell you should likely be shooting for a CCC value that is a bit higher—something ≥ 0.90—than what you might think of as a good r (say, 0.75), although in fact, what degree of either should be deemed acceptable depends on the sort of inference one is trying to make and why.
As you can see, the CCC for aggregated player OPS-RPs and actual team runs scored is 0.96, an excellent degree of concordance. The r(d, m) is the correlation between the differences in the measures’ values and their means; it indicates, essentially the directional drift from agreement as values of the measures increase or decrease.
The r(d,m) for player OPS_RPs and actual team run is negative—meaning that the former is underestimating actual runs as it increases. But it’s doing so at such a small rate—r = -.05—as to be practically irrelevant. The figure shows you that: the “line of perfect concordance” and the “reduced major axis” (reflecting the tilt associated with r(d,m) essentially overlap.
Bottom line: because estimating individual player runs produced from their OPSs generates very accurate predictions of team runs scored, we can have a high degree of confidence in it as a measure of individual hitter run productivity.
3. I compared the performance of RP_aa to three other schemes.
They are FanGraph’s weighted runs created (wRC), which is derived from wOBA; Bill James “runs created” (J_RC), which applies an intricate set of formulas to various offensive events (the derivation of which is a mystery, at least to me!); and Baseball Reference’s Rbat, which is a measure of hitting runs created above average, one also reported to be based on wOBA with various adjustments. (Because, I realize, the number of labels is proliferating to a degree that threatens comprehension, I’ve prepared a small glossary, which appears at the end of the post).
Only wRC and J_RC can be used straightforwardly to predict team runs. As can be seen, they both do excellent jobs:
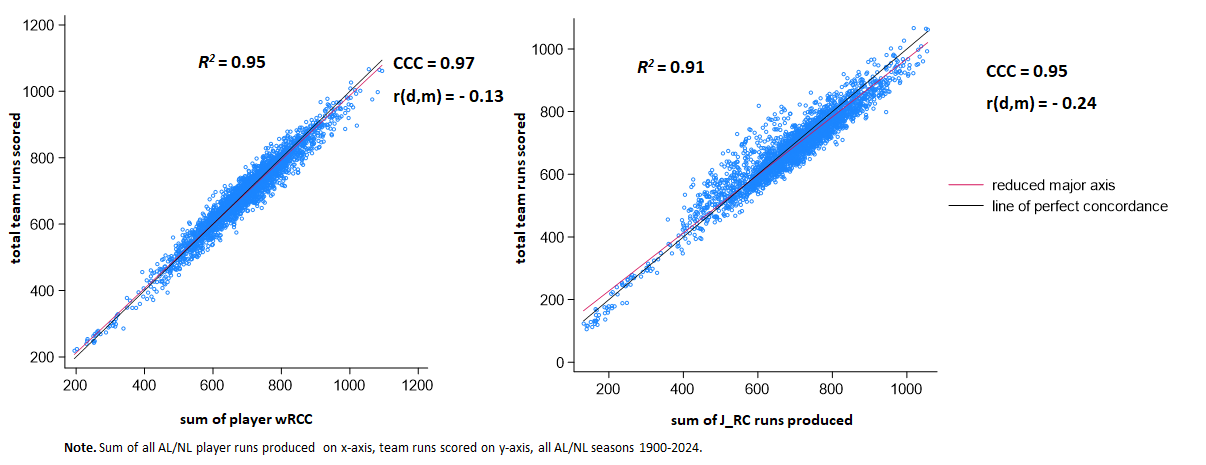
The R2’s and CCCs are a tad smaller and the r(d,m) a tad larger, than those associated with OPS_RP. But the differences are so small as to be practically irrelevant for inference, I’d say.
We can also look at the “runs produced above average” scores derived from all of these measures, including Rbat.
Start with the OPS RP_aa measure and wRAA (that’s what FanGraphs calls the “runs above average” version of its wRC measure) and J_RC_aa (what I’m calling the “runs created above average” of James’s measure, derived by subtracting from every player’s J_RC the league mean J_RC for the season in which he played)
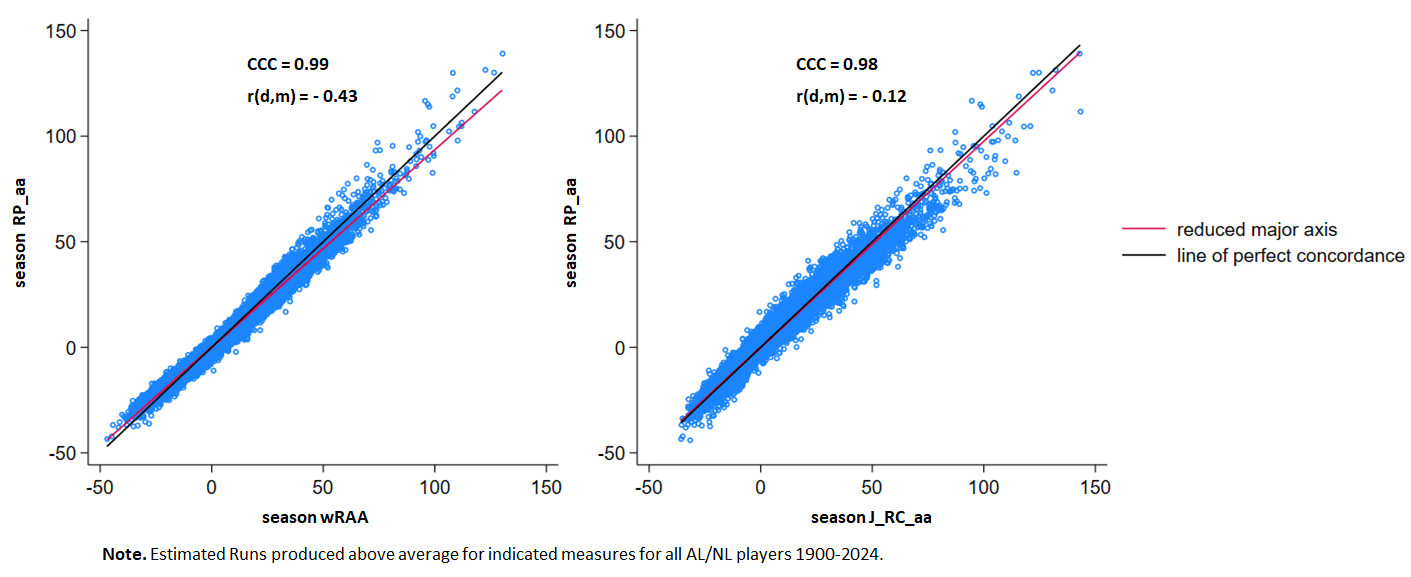
The r(d,m) for RP_aa and J_RC_aa— ‑0.43—is a bit of a worry, but I’m still impressed with these degrees of concordance.
Rbat turns out to be even more concordant with RP_aa.
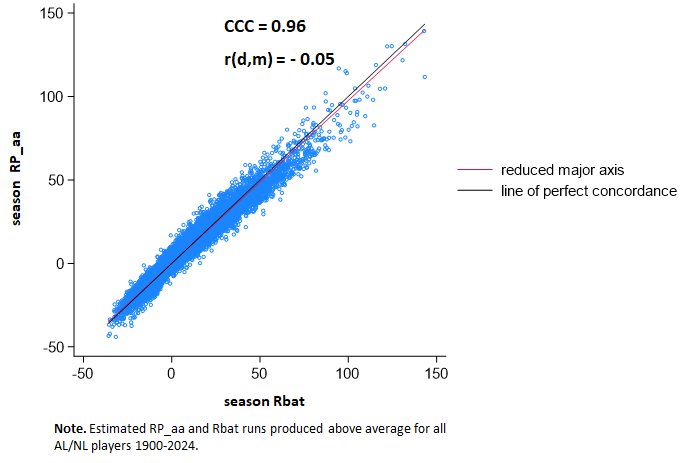
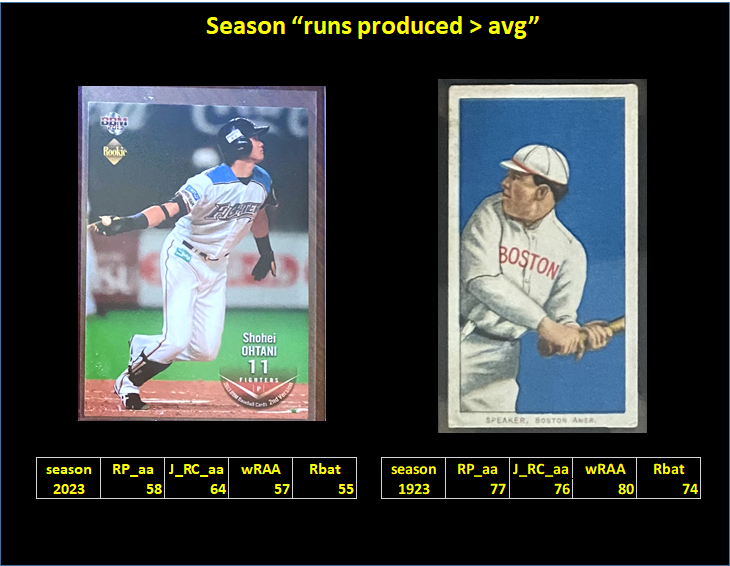
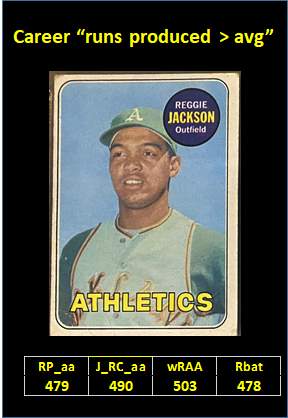
To make this concrete, consider:
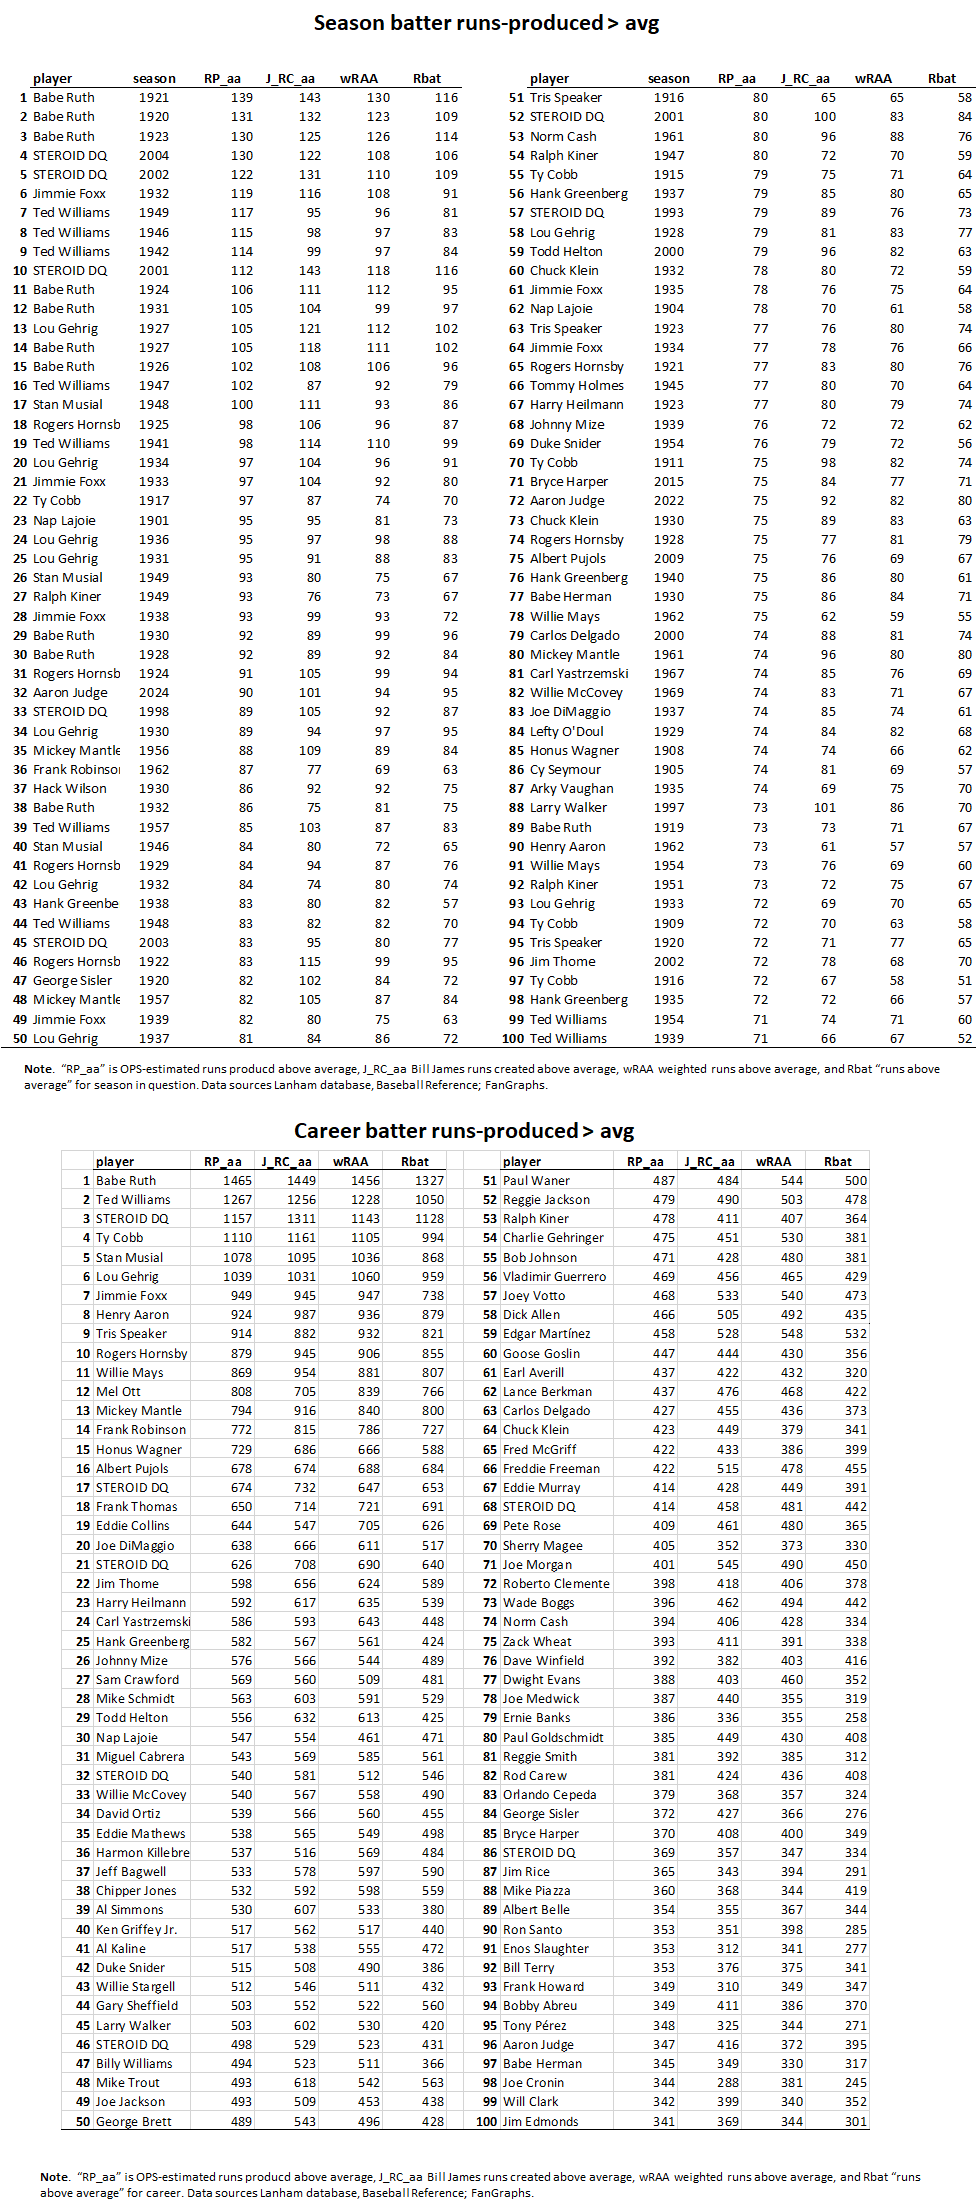
These tables compare the predicted number of runs produced for seasons and careers of players ranked by OPS-derived RP_aa’s. We can see the numbers for the various runs-above-average metrics are remarkably close. It does appear, though, that Rbat tends to generate more conservative estimates than the other three schemes.
So . . . We have four distinct ways of predicting the run production of individual hitters that are largely in agreement!
That’s a very agreeable outcome. It’s unfortunate, I guess, from a “prize-fighting” conception of baseball analytics, but very very satisfying from the more valuable “advancement of common knowledge” conception (although sometimes the first moves the second along, of course).
So pick whichever one you like! But do remember that unless you appropriately standardize the metrics, as I did for RP_aa in the last post, they won’t convey accurate information about the relative performance of players across time.
Next we’ll see how well the prevailing systems of WAR do in conserving this remarkable degree of agreement in the prediction of run production. . . .
Glossary
J_RC. An estimated measure of an individual batter’s runs produced. Developed by Bill James, it involves a formula based on various offensive events.
J_RC_aa. An estimated measure of an individual batter’s runs produced above average. Derived by subtracting from the hitter’s J_RC the J_RC of a hitter with the same number of plate appearances and the league mean J_RC per plate appearance.
OPS-RP. OPS‐estimated runs produced. An individual player estimate of runs produced derived from the number of team runs we’d expect to be scored based on the player’s OPS and plate appearances.
Rbat. Baseball Reference’s measure of a hitter’s estimated runs produced “above average.”
RP_aa. An estimated measure of an individual batter’s runs produced above average. Derived by subtracting from his OPS-RP the expected runs produced by a batter with the same number of plate appearances as the player in question but with the league mean OPS.
wRAA. FanGraph’s wRC “above average.”
wRC. FanGraph’s wOBA derived measure of a hitter’s estimated runs produced.
