
 Consider two conspicuous features of contemporary major league baseball: accelerating supersonic fastball speeds and spiraling strikeout rates.
It seems natural to see the first as the cause of the second.
But is it?
I’m not the first to wonder. Indeed, my own interest is inspired by an insightful commentary by one of my favorite sabermetricians, Sean Smith. Comparing performances in 2007 to 2026, he concluded that most of the increase in strikeout rates—a bit north of 60%—was due to the increased fastball velocity. I strongly recommend that everyone read his analysis (indeed, that everyone read his Substack essays regularly).
I was sufficiently intrigued/obsessed that I decided to try to extend Smith’s analysis. To my surprise, my conclusion turned out to differ from his. The principal reason has to do with Smith’s use of the 2026 season as the endpoint for his assessment of how increases in velocity and strikeouts relate to one another.
Take a look at this:
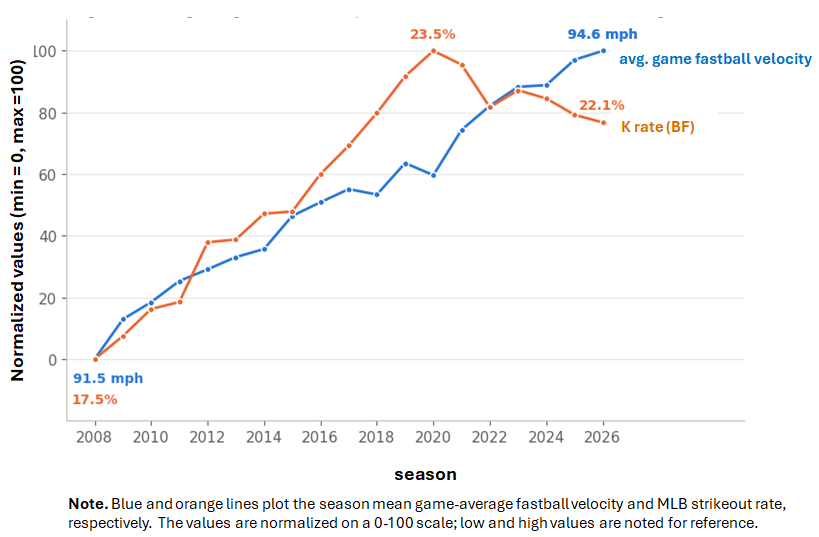
What this shows is that strikeout rates, while higher today than in 2008 (when MLB instituted a uniform system of pitch-speed tracking), have actually declined noticeably since 2020, despite the continuing surge in velocity over that period.
That’s not quite what one would expect to see if increasing fastball speeds were driving escalating strikeout rates. Of course, we shouldn’t get too excited about it, because a good deal of the post-2021 drop will be attributable to the advent of the universal DH rule in 2022.
But even more important, it means that we are likely to misestimate the relationship between these two trends if we simply draw a line between 2008 and 2026 and ignore what happened in between.
So I decided to try to examine how strikeout rates and velocity varied over the entire 2008-2026 period in a more fine-grained way.
Some additional method notes appear at the bottom of the post, but here are the essentials:
- My sample consisted of FanGraphs’s game logs for every regular pitcher appearance between 2008 and 2026 (give or take a few missing ones)—361,928 outings by 3,242 pitchers.
- From each pitcher appearance, I extracted the pitcher’s game-average fastball velocity, the number of batters he faced, and the total number of strikeouts he recorded.
- I then fit a binomial logistic regression model to the data. The model predicts for any given season the probability a batter will strike out given a specified game-average fastball velocity.
Here’s something interesting that the model shows us:
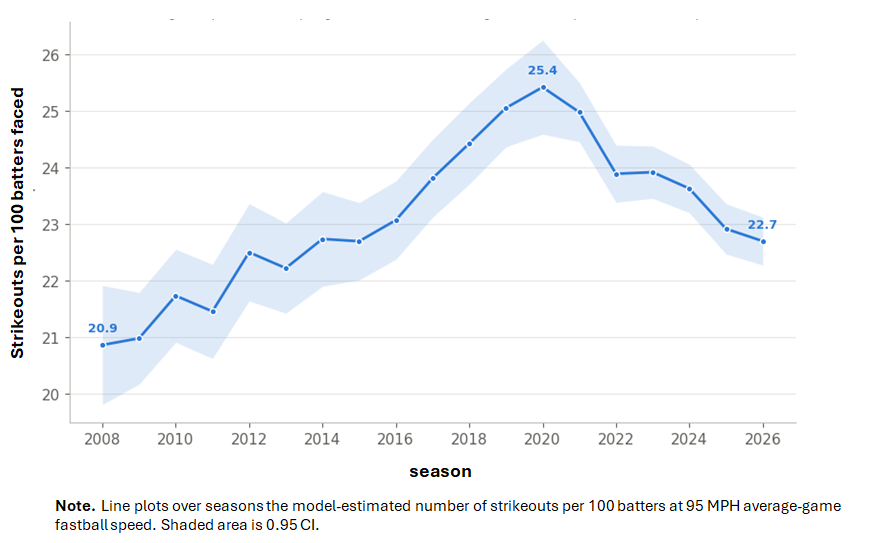
Basically, at a constant average-game fastball speed of 95 MPH, the strikeout rate trends upward until 2020 (itself a universal-DH rule season), when it starts to decline pretty noticeably.
That tells us two things. One, which we already knew, is that strikeouts conditional on velocity decline after 2020.
The other, though, is that batters, over the period in which strikeouts were increasing, tended to strike out with increasing frequency against pitchers throwing the same speed.
Here’s another look at that same phenomenon:
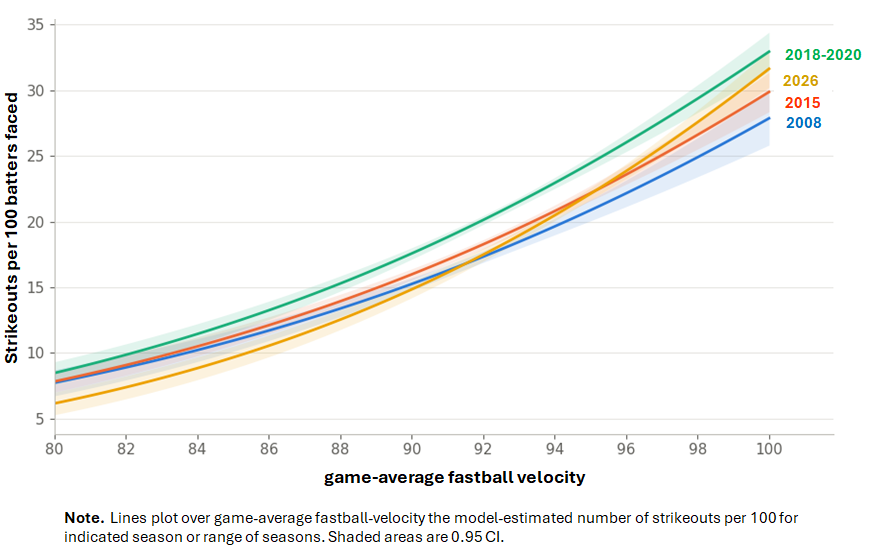
Over the period during which strikeouts were increasing, hitters were more likely to strike out at any given pitch speed than they were in 2008. This was especially dramatic in 2018-2020—the “peak range,” let’s call it, since we don’t want everything to turn solely on what occurred in the COVID-shortened 2020 season.
Of course, it doesn’t follow that because strikeout rates were increasing while holding pitching speed constant, rising fastball velocities didn’t drive the surge in strikeout rates that crested in 2020.
As average-game speed increases, strikeouts increase, too—in every season between 2008 and 2026. In addition, in nearly every season between 2008 and 2020, the game-average fastball speed went up. Whenever that happened, a greater fraction of hitters faced faster pitches than in the preceding season.
Because hitters strike out more often as speeds increase, and because more hitters were facing increasingly fast pitches between 2008 and 2020, strikeout rates would have been expected to jump even if hitters hadn’t been striking out more often against pitches thrown at the same speed.
Thus, to figure out what “drove” strikeout-rate escalation, we need a way to divvy up the portion associated with increased velocity, on the one hand, and the portion associated with velocity-unrelated influences, such as batter propensities, on the other.
We can do that too with the regression model:
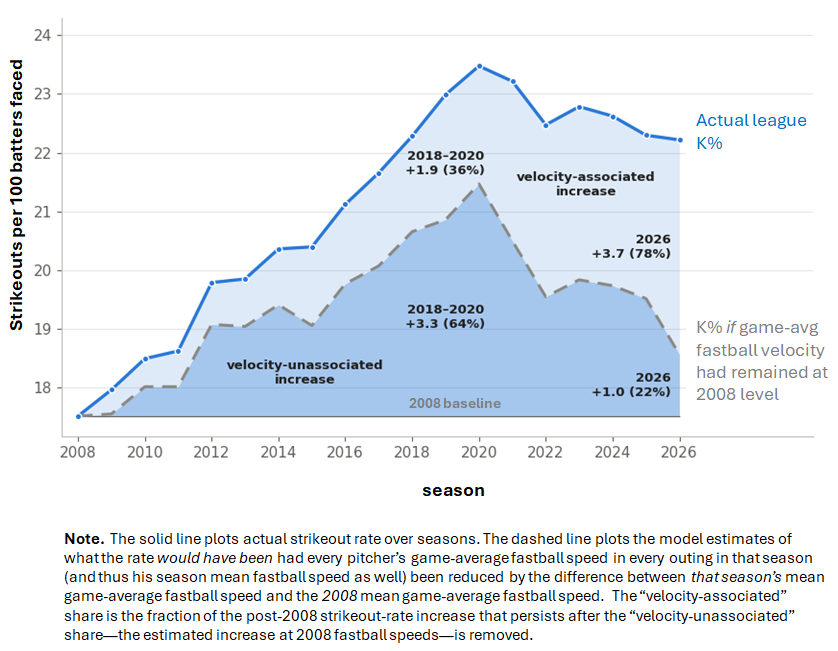
This figure shows what the strikeout rate would have been in every post-2008 season if pitchers that season had been pitching no faster than their 2008 counterparts. To figure that out, we just subtract from the game-average fastball speed of every pitcher in every outing in the relevant season an amount equal to the difference between how fast pitchers threw on average in that season and how fast pitchers threw on average in 2008.
 At that point, we can determine the share of the increased strikeout rate associated with greater velocity: it’s exactly that fraction of the increase over and above the increase that would have been observed had pitchers in that season been pitching at the 2008 speed.
As can be seen, from 2012 to 2020, the share unassociated with increased velocity (dark blue) was consistently larger than the share associated with velocity (light blue). If we compare 2008 with the 2018-2020 peak range, the velocity-unassociated share of the strikeout-rate increase was 64%, the velocity-associated share 36%.
Now, if one compares 2008 to 2026, then the velocity-associated share climbs to 78%. (This is an even higher proportion than Smith records, mainly because he uses pitcher season-mean fastball velocity rather than game-average velocity.)
But if we do that, we are making a biased inference. Strikeout rates fell in between 2020 and 2026—again, in significant part because of the adoption of the universal-DH rule in 2022 (for more on pitcher batters, see method note 4). Velocity appears to be “driving” the strikeout rate over the 2008-2026 period “as a whole,” then, only because the fraction unassociated with velocity declined from the peak strikeout-rate seasons.
So if you want to figure out whether increased velocity or increased strikeout propensities drove strikeout rates, the answer depends on when you ask. If you ask the question when strikeout rates hit their zenith, the answer is pretty clear: both mattered, but the ability of pitchers to throw faster mattered a good deal less than hitters’ speed-independent tendency to whiff.
Or at least that’s what I’m seeing in the data. But maybe you will see something I’m missing! Have a look for yourself: the data along with my analysis codes are in the library.
Method notes.
1. Fastball velocity. Sadly, it’s not a straightforward matter to nail down what counts as a “fastball” in various published sources. Reasonably enough, MLB includes “four-seamers, sinkers [two-seamers], and cutters.” Unreasonably, it hasn’t been consistent on which of these is included in its Statcast fastball classification or which if any of its past-season classifications it has backdated (“we may have retroactively changed some classifications”!). Remarkably, no one is sure whether cutters have been identified and categorized in a consistent way.
I decided to use FanGraphs’s FBv series, which has consistently included both four-seamers and two-seamers/sinkers. I think Smith might have used vFA(sc), which is limited to four-seamers. I made a different selection—not only because two-seamers/sinkers are fastballs, but also because not all MLB pitchers use four-seamers as their fastball pitches (between 15% and 20% of appearances per season end up with no pfxvFA/vFA(sc) readings at all, and 6.5% of pitcher seasons get no velocity measurement in that category).
2. Fastball velocity. Again, I started in 2008, because that’s when MLB instituted a uniform pitch-speed tracking system. However, in 2017, MLB switched from PITCHf/x cameras, which measured speed 50 feet from home plate, to “Statcast, TrackMan” radar, which measured speed at release. Looking at pitchers who faced at least 400 batters in both 2016 and 2017, I determined that the average speed gain was 0.22 MPH, compared to average speed losses of 0.24 from 2015 to 2016 and of 0.25 from 2017 to 2018, an expected consequence of age decline. That means that the speed increase associated with the 2017 change in the measurement point was in the neighborhood of +0.5 MPH. A subsequent change from radar to optical cameras in 2020 didn’t show any comparable change. So to make the fastball velocities commensurable across the entire 2008-2026 period, I added 0.5 MPH to the reported game-average levels from 2008-2016.
I also used a regression analysis (weighted by batters faced) to determine park-season effects on the measurement of pitcher fastball speeds.
3. Game-average pitcher fastball velocity. I confined myself to “regular” pitcher outings in contrast to outings by position players, whose game logs I simply dropped (619 “pitcher” seasons, 1,031 outings).
4. What about pitcher batters? As noted, the decline in strikeout rates from 2022-2026 is attributable at least in part to institution of the universal-DH rule. Ignoring that biases the “velocity-associated” share upward for any comparison based on 2008 (or earlier) and 2026: as the area graph shows, anything that reduced strikeout rates relative to the peak period misleadingly obscures how much smaller the “velocity-associated share” was then. From 2008-2019, pitchers batted in the NL; so comparisons of how velocity and strikeout rates related between 2008 and 2019 are “apples to apples” (and no, pitcher strikeout rates did not drive the 2008-2019 escalation!). The 2020 COVID-shortened season, in which strikeout rates reached their zenith, was a universal-DH season. It’s a trivial impact, but since the strikeout rate would have been a bit higher had NL teams let pitchers bat that season, the universal DH that season means that the velocity-associated impact was actually inflated a small amount relative to 2008 (for the same reason that it is misleadingly inflated in 2026 relative to 2008).
5. Raw counts vs. modeling. As indicated, I used a regression model to determine the relationship between game-average fastball speed and strikeout rates.

Here the outcome variable is the probability of a strikeout of any individual batter faced for pitcher i in appearance j in season s. The predictors are the game-average fastball velocity for the same pitcher in the same appearance and that pitcher’s season-mean game-average fastball speed.
The benefit of using the model is that it can tell us what the strikeout rate would have been for pitchers who had 2008 pitching speeds in 2018-2020—or even what it would have been for pitchers in 2008 if those pitchers had somehow been able to throw as hard as pitchers in 2018-2020.
But one can also do an alternative, raw-data comparison without the model. The question is how often the 2018-2020 batters would have struck out had they been facing 2008 pitch speeds. So first one distributes the 2018-2020 batters-faced total across the 2008 span of pitch speeds in proportion to the number of batters faced at those speeds in 2008. To assure that we have a sufficiently large enough number of batters faced at every level, one can pool pitch speeds at either extreme—81 MPH or lower, pitches 99 MPH or higher; but otherwise one can use 1-MPH increments in between. Then one multiplies the number of 2018-2020 batters at each speed increment by the 2018-2020 strikeout rate at that speed, adds up the results, and divides by the total number of 2018–2020 batters faced. The result is a counterfactual 2008-pitchspeed strikeout rate for the 2018-2020 peak period. The difference between the actual 2018–2020 rate and this counterfactual rate, divided by the overall increase from 2008 to the 2018–2020 peak, is the velocity-associated share. That quantity turns out to be 34%, leaving 66% of the increase as velocity unassociated—nearly the same as the regression model’s 36% vs. 64%.