
Okay, after the last post, it had to be done: the all-time best collection of rookie performers ever versus the best team in MLB history—the 1927 Yankees!
Could these Super Rookies really compete? I built a Monte Carlo simulation to figure that out. But I’ll get to that in a minute.
 First let’s take a look at the starting lineups, and see how the two squads match up!
On the mound for the Rookies—appropriately enough—is the 1910 Yankees’ Russ Ford. Ford compiled a 26-6 record that season with a 1.65 ERA—good enough for the all-time highest WAR for any rookie (11.4). We will treat him as inexhaustible, and let him pitch every game.
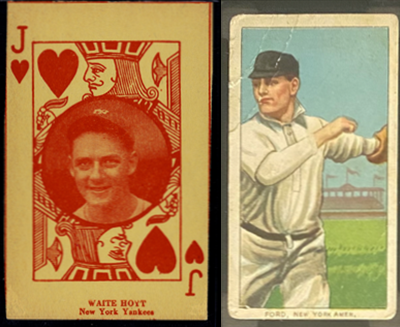
The ’27 Yankees aren’t going to be restricted to one pitcher in this series. But if they were it would be their ace (or Jack of Hearts) Waite Hoyt, who was 22-7 with an ERA of 2.63.
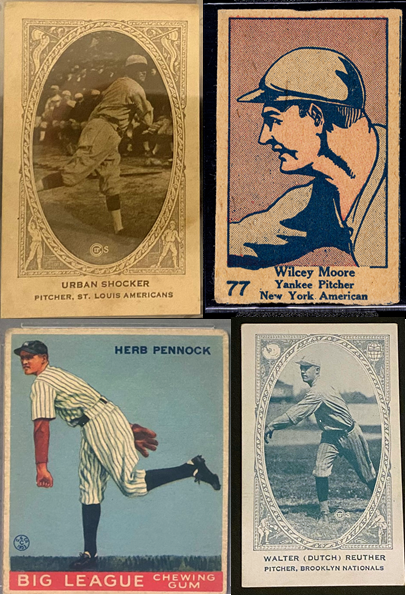
This legendary Yankees’ squad, though, was deep in pitching, with Herb Pennock (19-8, 3.00 ERA), Urban Shocker (18-6, 2.84), Dutch Reuther (13-6, 3.38), and Wilcey Moore (19-7, 2.28). So they shouldn’t be too handicapped by having to rely on their entire staff.
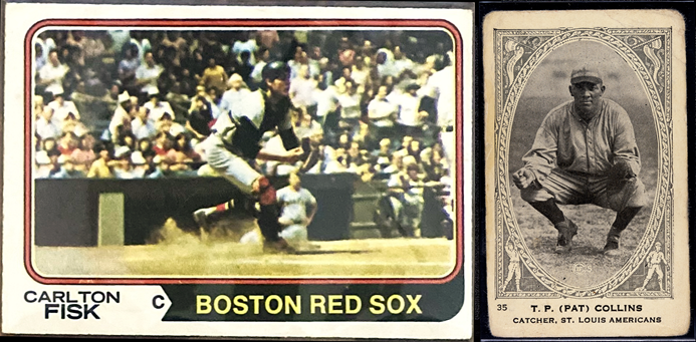
Behind the plate for the rooks is Carlton Fisk, who put up a .293/.370/.538 slash line during his first full season in 1972, generating an 8.3 WAR, a figure unmatched by any other first-year catcher.
For the ’27 Yankees: Pat Collins, whose .275 batting average with 7 HR and 36 RBI in 313 ABs makes him one of the weakest hitters on the club. I’d rather play Fisk!
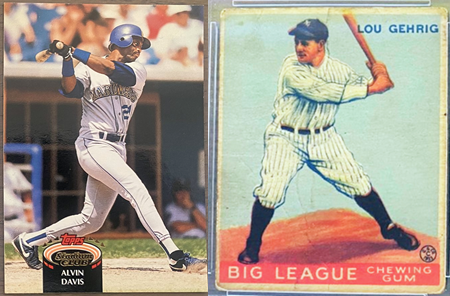 The edge at 1B definitely goes to the Yanks, who enjoyed the services of Lou Gehrig: in 1927, he hit .373 with 47 HRs and 173 RBIs!
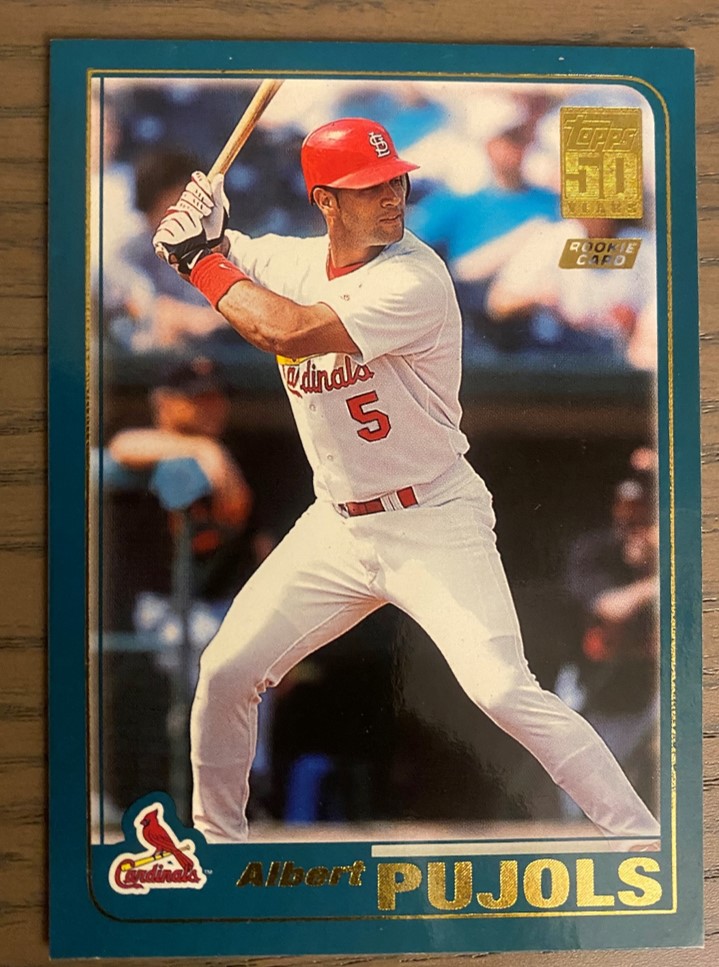
The Rookies will be starting Alvin Davis, who in 1984 generated a WAR of 5.8 by slamming 27 HRs while batting .284. Davis had a few more good seasons (e.g., .305/.424/.496 in 1988), but his major league career ended in 1992, after which he did a very brief stint in the Japanese major leagues. (Too bad Albert Pujols, whose WAR was 6.6, played less than 1/3 of his games at 1B during his rookie season.)
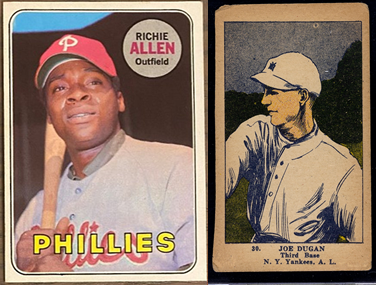
At third base, the Rookies shine! Dick Allen played that position (one he had never played before!) for the Phillies in 1964, when he hit .318 with 29 HRs and 91 RBIs, a performance that earned him the all-time high WAR for rookie third basemen—8.8.
Joe Dugan, the weakest regular (.269/.321/.362), manned the hot corner for the ’27 Yankees. Advantage: Rookies.
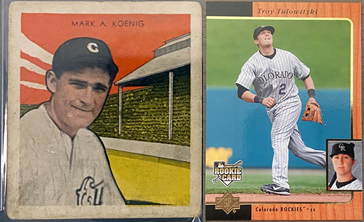 The opposing shortstops: Troy Tulowski, who had a very nice 6.8 WAR in 2007, which turned out to be his high water mark during a decent but by no means HOF-worthy 13-season career; and Mark Koenig, a journeyman infielder (who five seasons later played a part in one of the most dramatic moments in World Series history) with modest offensive numbers in ’27 (.285/.320/.362).
Looks pretty even there.
The opposing OFs are both loaded!
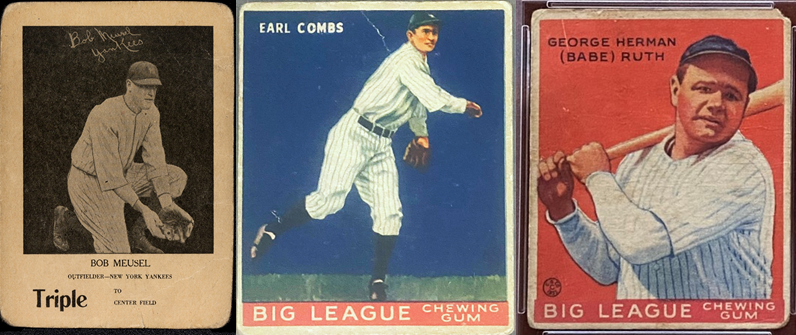
Of course, the Yankees would have been fearsome no matter who else they put in the OF next to Ruth, who in ’27 hit his long-standing MLB single-season record of 60 HRS, while batting .356, and driving in 165 runs to boot! But future HOF member Earl Coombs (.356/.414/.511) and Bob Meusel (.337/.393/.510) were also plenty formidable.
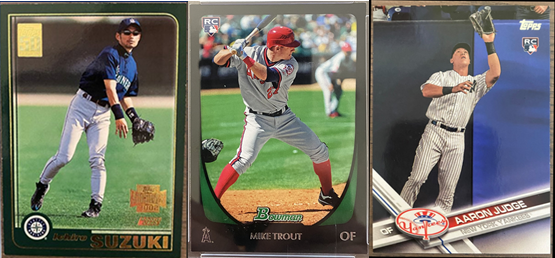
The Rookies: Ichiro Suzuki, who earned ROY honors with his .350 league batting championship (6.7 WAR) in 2001; Mike Trout, whose .326 batting average and 49 HRs, generated the highest rookie WAR ever (10.5) for any non-pitcher; and Aaron Judge, who slugged 52 HR and drove in 114 while posting a 1.049 OPS in his rookie campaign in 2017, good for an 8.0 WAR. All these guys will be in Cooperstown (barring some freak event in Judge’s case). The Rookies shouldn’t feel outclassed here.
Now the simulation.
This was the strategy in brief:
- compute the two squads’ respective team WAR per game played;
- use those totals to predict via a regression model their respective winning percentages against “average” opponents;
- determine the probability of a team with one of those winning percentages defeating the other in a single game; and then
- simulate 2,500 7-game series in which individual game outcomes correspond to that probability.
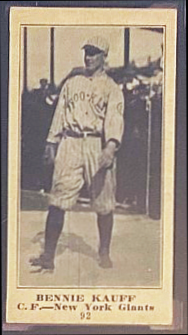
As is likely obvious, I put the rookie squad together by selecting the players with the highest first-season WARs at every position, except for OF, where I selected the players with the top three rookie-season WARs (although I did pass over Benny Kauff, whose 1914 Federal League 6.8 WAR eclipsed Ichiro’s first-year AL mark by 0.1). The combined WAR of the Rookies’ team members is 72.9.
Treating the WAR totals of Ford and Klein as having been achieved in 154-game seasons and those of the remaining team members as having been achieved in 162-game ones, the average WAR per game for the Super Rookies turned out to be 0.454.
The ’27 Yankees, widely acknowledged to be the best team ever, in fact have the highest team WAR in MLB history: 69.5. Having played 155 games (they played an extra to make up for one that ended in a tie), their WAR per game was 0.448.
The regression model predicts that teams with the WARs per game of the Super Rookies and ’27 Yankees will have winning percentages of 0.757 and 0.751, respectively.
Again, treating those winning percentages as commensurable indicators of the relative strength of each squad against “average” MLB opponents, the Rookies are in fact a 1.03:1 (50.8% to 49.2%) favorite in any game.
Favored even slightly in every single game the two teams play, the Rookies must be favored to win any 7-game series, too. But not by much.
To figure out the Rookies’ series edge, I used a Monte Carlo simulation. That simulation involved 2,500 best-of-7 series in which the outcome of every game was determined randomly consistent with the regression estimate of the relative strength of the two teams.
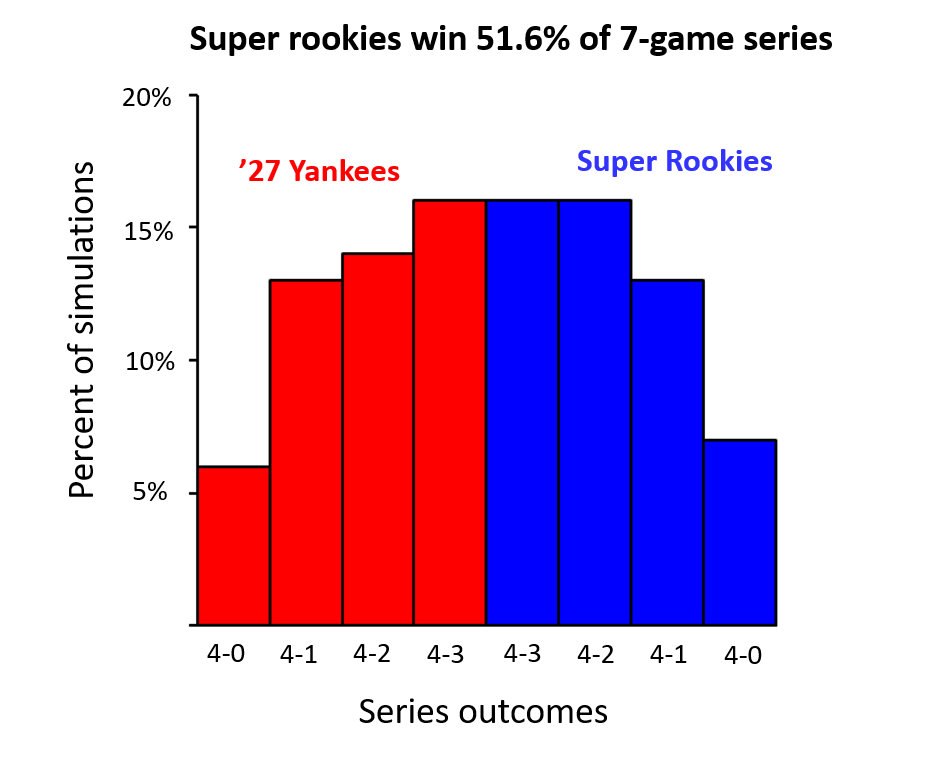
The Rookies won 51.6% of those 7-game series.
That’s way too close for the Rookies to feel super confident in any given showdown!
As this graphic illustrates, there were as many series in which the ’27 Yankees won in 7 games as the Rookies did. There were even some in which the Yankees won in 5 or swept. The modal outcome was Super Rookies in either 6 or 7 games, an outcome observed in 32% of the series.
 You can treat the percentages of times that teams won in a particular number of games as the likelihood that they would do so in any given 7-game showdown.
So: that’s how I did it. But there are many of other ways.
Indeed, here are some of the choices I made that one might revise:
- I had the Rookies use only 1 pitcher, Jack Ford. One could instead add to their staff the top three or four best rookie hurlers and assign the team an average of their WARs. That would weaken the Rooks, certainly;
- Similarly, rather than allocating the Yankees their full team pitching WAR, I could have assigned them a WAR equal to the average of their best 3 or 4 starters. Or had I assigned the Rookies a full staff, I could have even adjusted the simulation so that the respective team WARs (and corresponding 1-game odds of prevailing) would have reflected game-specific pitching matchups. That would be pretty cool, actually.
- I allowed the ’27 Yankees to get the benefit of their team WAR rather than restricting them to that of their regulars—the latter option would have substantially handicapped them.
- By the same token, I could have assigned each of the Rookies not his actual WAR but an adjusted figure (WAR162 or WAR154) that matched what it would have been had he played every one of his team’s games, a revision that would have boosted their teams’ strength.
The data and coding scripts I used are available in the data section of the site. So if you want to come up with your own simulation strategy, have at it!