 Having eventually tunneled over to BIP-ERA (what I’m calling the measure for balls-in-play runs allowed per game) by descending down the infamous “batting average for balls in play” (BABIP) rabbit hole, I’m now encountering BABIP again as I try to claw my way back to the surface.
The paper reports a measure of how BIP-ERA predicts a pitcher’s opponent BAPIP. But Michael Schell, in stunningly generous feedback on it, showed me that it is possible & worthwhile to estimate BABIP directly.
So that’s what I decided to do. Basically, I took the same multi-level regression model that I’m now using to estimate BIP-ERA and ran it on BABIP. As always, I had to work out some kinks but it is working pretty well at this point.
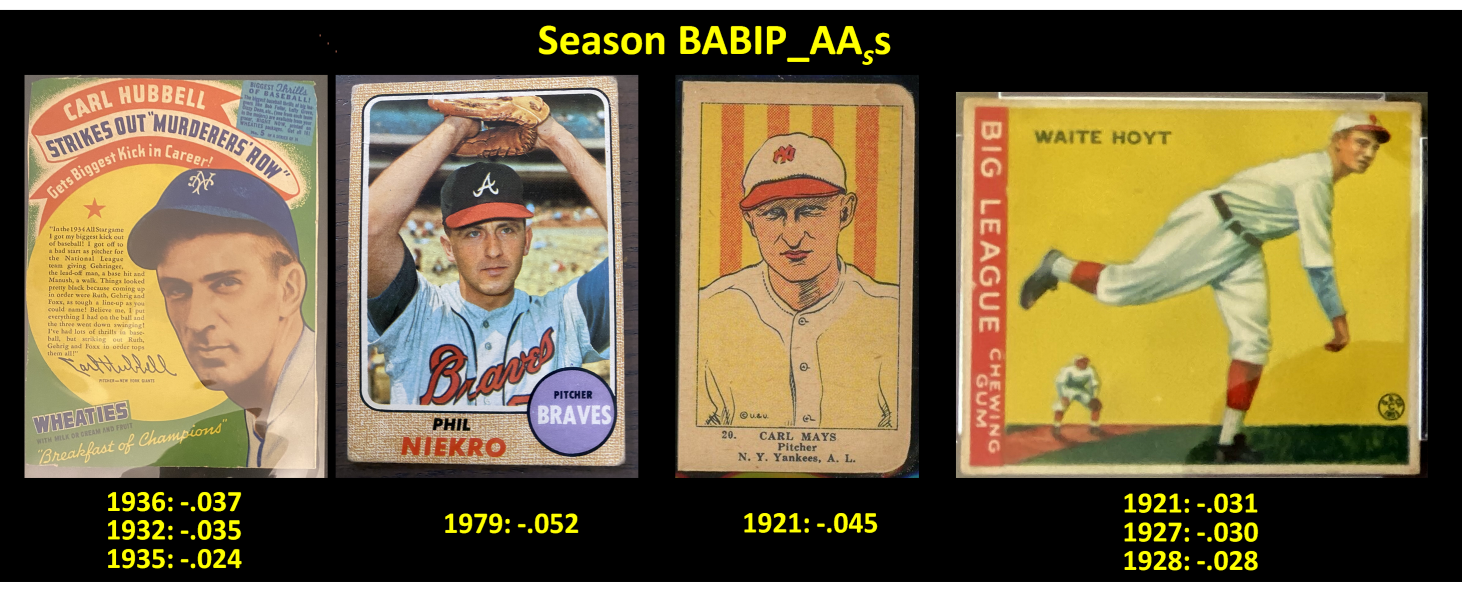
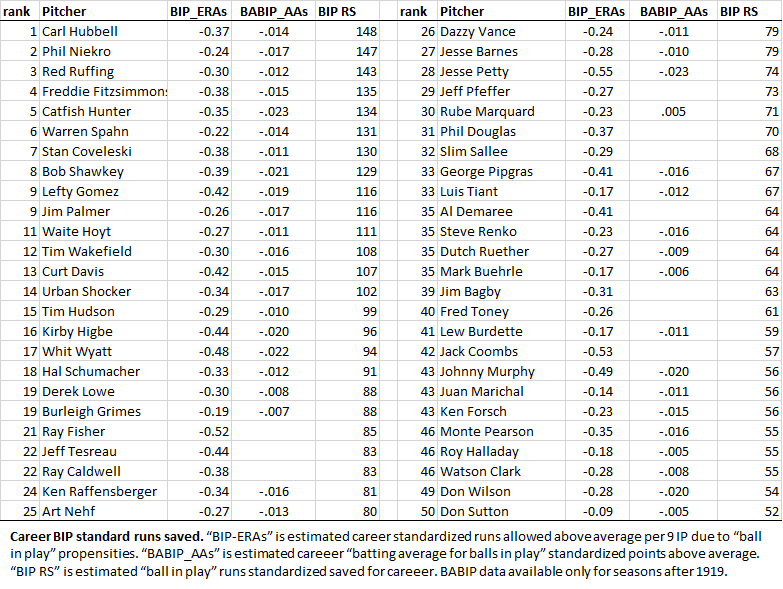
The following two tables identify the top 50 season and career BIP standard runs saved. I’ve added the corresponding season and career BABIP_AAs for opponent “batting average on balls in play above average.” Essentially, this metric reflects a pitcher’s estimated BABIP “points above average” for a season (in the case of career, a weighted season average). If BABIP_AAs is negative, then, a pitcher is estimated to have shaved that many points off his opponents’ batting averages for balls in play.
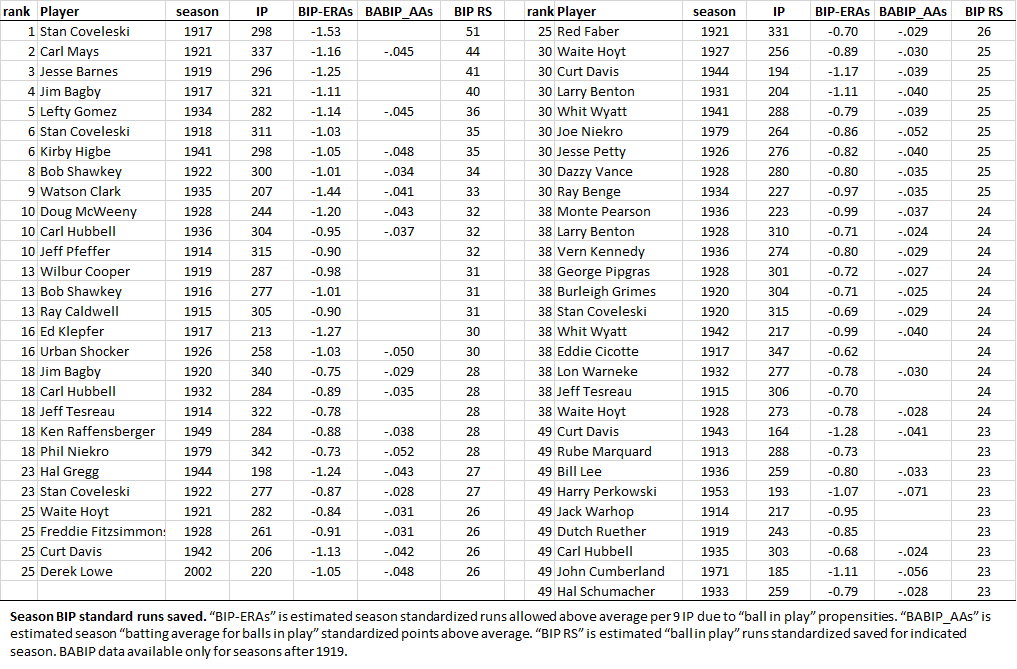
You might have guessed what the “s” means: standardized. Because AL/NL-wide BABIP has jumped around a lot over time, it makes sense to use standardization to put this metric on a scale that is uniform across AL/NL history. BIP-ERAs is the standardized version of the raw runs BIP-ERA—although I do report individual estimates of the latter as well as the former in the paper.
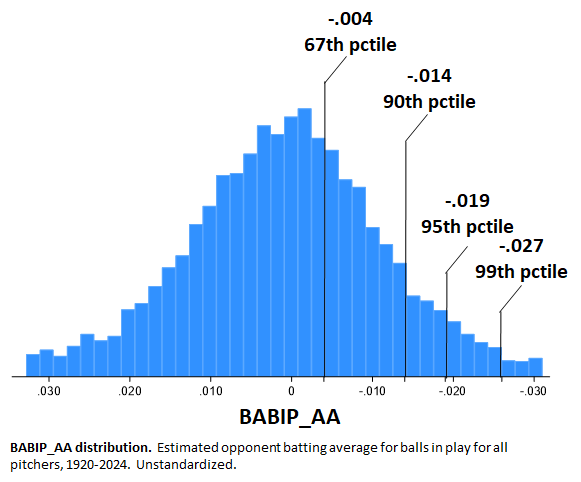
I should note that BABIP_AA (with or without the “s”) is calculated in exactly the same way as BIP-ERA, which is to say, by considering how the types of balls in play (infield grounders and popups, outfield fly balls and line drives) influence BABIP controlling for both team fielding and those elements of pitching that prevent balls in play (strikeouts, walks, hit batters, home runs allowed).
The former definitely has to be partialed out—otherwise, we can’t apportion BABIP between a pitcher and his fielders.
But the latter—the pitchers non-BIP pitching characteristics—might merit inclusion. It depends on one’s theory of the model. If you think BABIP is a function of the probability that different types of balls in play have of turning into hits, then it makes sense to just use BIP-type predictors. But if the idea is that there is some latent or unobserved tendency to stifle hit-productive contact, then one might include strikeouts, home runs allowed, and walks too, treating all aspects of pitching performance as observable indicators of that latent characteristic.
I dunno know which approach is best!
Calculated in the manner proposed, though, BABIP_AA measures a durable and persistent pitching proficiency (an issue that has loomed large in debates over the McCracken conjecture). The Intraclass Correlation is 0.88, meaning that 88% of the variance in BABIP_AA is attributable to individual pitcher characteristics (remember, too, that BABIP_AA is derived by a method that excludes the impact of team fielding support).
If you look at the season numbers, you can see every 0.10 BIP run per game saved equates with roughly 5 points of BABIP. That was the relationship I got when I estimated BABIP reduction based on BIP-ERA directly.
But I’ll futz a bit more (try the “latent characteristic” approach, e.g.) and then decide whether to stick these data into the paper.
What do you think?