
 In the last post, I adverted to the utility of standardizing runs in order to make sense of the contribution that “ball in play” (BIP) propensities have made to pitcher effectiveness over time. I want to say a bit more about that now.
The basic issue is that measures of pitching performance are not directly comparable across seasons. As is well known, the “run environment”—factors bearing on the volume of run scoring—changes over time as a result of myriad factors: modification of rules; changes to equipment; the condition and material of the playing field; cheating (i.e., steroid use), etc. None of these has any connection to player skill.
As skill-unrelated run scoring increases and decreases, measures of the impact of pitching tendencies that suppress runs will likewise increase and decrease in a manner disconnected from skill. In addition, fluctuations in run scoring alters skill-unrelated variance in metrics of run-scoring suppression.
Consider the wild fluctuations in both the means and standard deviations of pitcher “runs allowed per game” (RAPGs) over AL/NL history:
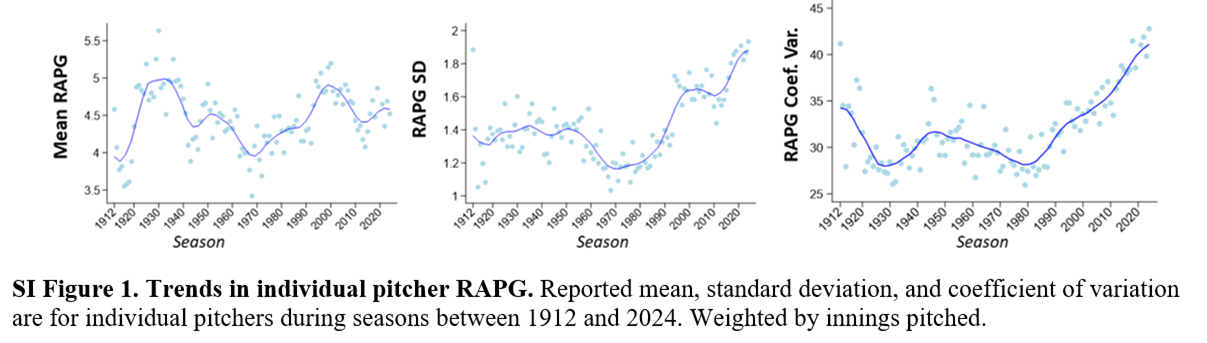
What all this means is that the scale in which pitching metrics assess performance is regularly shfiting in a manner that confounds any inferences about the quality and impact of the performances they measure over time. The same, of course, goes for metrics that apply to offensive and defensive contributions to runs.
As discussed in various other posts, one way to fix this problem (applied most systematically and expertly by Michal Schell in his study of hitting proficiency) is standardization. Pitching performance metrics can be transformed so that they measure how many more or fewer standard deviations in runs per game a pitcher is estimated to be allowing relative to the average or mean pitcher (conditional on equivalent team-fielding support, of course). This quantity, called a z-score, puts performance differentials on a common scale across seasons. (You can see how this same basic strategy works for batting averages in this post.)
For convenience, we can assign a run-value to this score. For metrics that purport to measure above/below average RAPG, it makes sense to treat each z-score unit as equivalent to 1.5 runs—because 1.5 is the mean standard deviation in pitching runs allowed per game across AL/NL history. This technique will tend to magnify the run-suppression value of pitchers who play during relatively “low” run per game periods and shrink that of pitchers who play during relatively “high” ones.
In the BIP-ERA paper, I report pitcher performances in both raw and standard runs, but emphasize the latter—to help readers form an accurate picture, in particular, of the evolution of the relative importance of pitchers’ abilities to blunt the quality of batter contact (BIP-ERA) and to avoid permitting batter contact altogether (BNIP-ERA).
To give you a sense of what the impact of standardization is, consider:
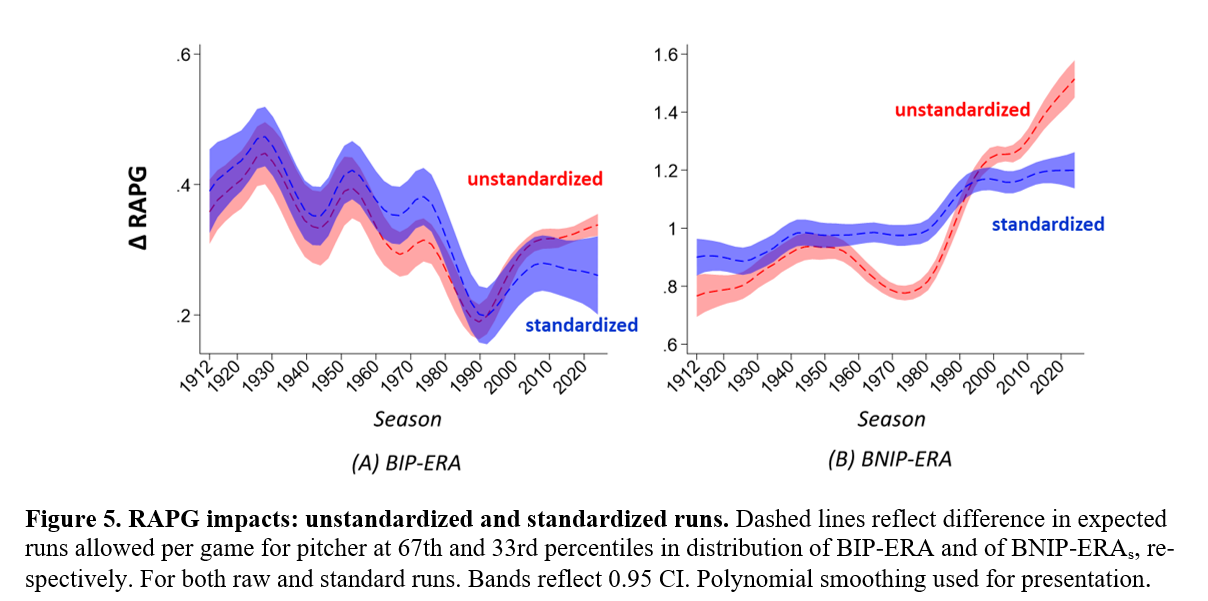
Note two things here. First, standardization modestly affects BIP-ERA. It tends to slightly push up BIP-ERA performances of pitchers in the 1960s and early 1970s, a period in which run suppression was low. Likewise it mutes the same for pitchers since 1990, a period in which runs allowed, and particularly variance in the same, has increased. Overall, the trend is downwards, which is consistent with the relative declining contribution of BIP-ERA to RAPG variance explained.
Second, the impact on BNIP-ERA is quite different. For sure, standardization boosts mid 20th-century pitchers’ performances. But differences in BNIP-ERA remain much more consequential today than they have at any other period in AL/NL history. This is consistent with the swelling influence of so-called fielding-independent pitching over the least quarter century—part of baseball’s “Great Transformation” to a shoot-out between strikeout pitchers and home run hitters.
Here are the top 25 for season “runs saved” and career “runs saved” pitching performances, measured in both raw and standardized terms.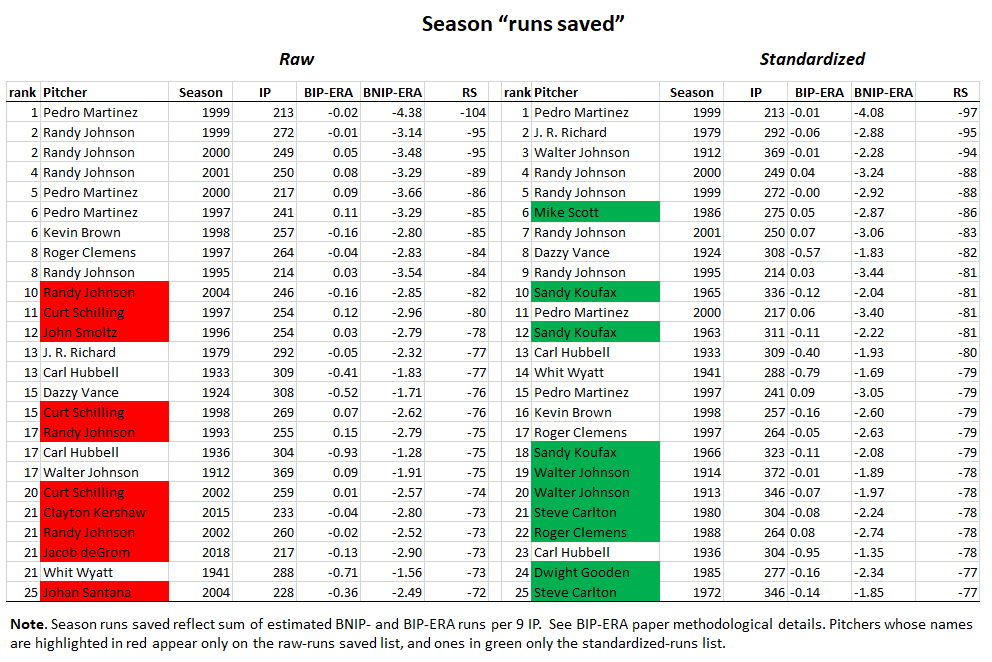
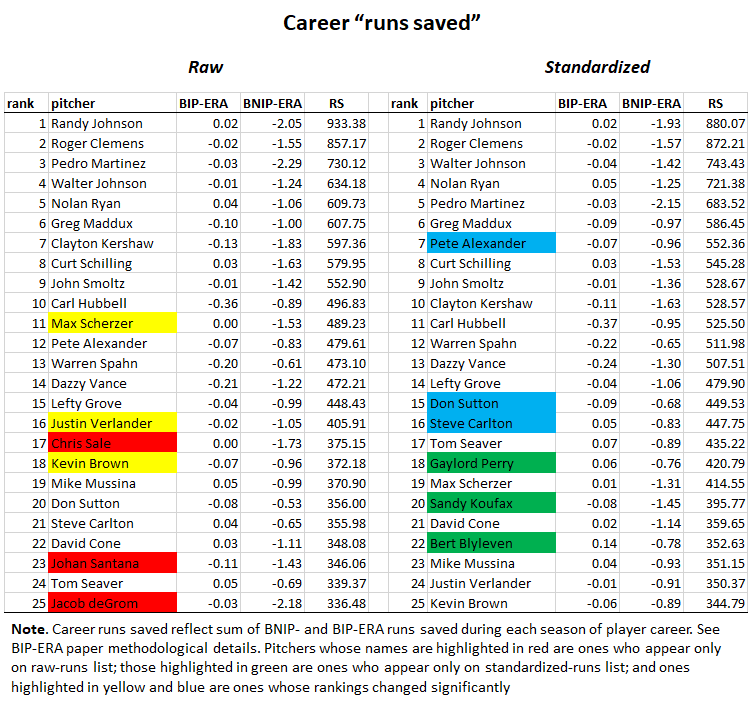
You can again see that pitchers from low-scoring periods are getting a boost with standardization relative to pitchers of the last quarter century or so. I’d argue that the standardized rankings are closer to a true indicator of the impact of the reported pitchers’ performances in the times they played—whether those times are recent or remote.
In sum, standardizing runs makes the aggregate trends in the relative importance of BIP-ERA and BNIP-ERA more readily apparent at the same time that it removes a scaling bias that exaggerates the relative impact of more recent pitchers.
Or that’s what I think; what about you?
 But I will note that the difference in how well Walter Johnson’s best seasons rank relative to Randy Johnson’s in the standardized as opposed to the raw season-runs saved lists reminds me of the conflict I once noted in FanGraphs’ and Baseball Reference’s Johnson measurements. I’d say Baseball Reference is managing, on this analysis at least, to get closer to Walter’s true value in his best seasons.
That’s enough—more than enough, as usual—for now.
But I do plan in the near future to look more systematically at how standardizing runs compares to the interestingstrategy that BBR and FanGraphs both use to try to convert “runs saved” to “team wins” in their WAR systems.
Bye bye!