
I’ve described in broad strokes the analytical strategy and the corresponding statistical model used to estimate BNIP-ERA and BIP-ERA. These are the two elements of pitching proficiency that correspond, respectively, to preventing balls in play altogether and stifling their run-productive impact when they occur.
What is the relative influence of these components of pitching effectiveness?
Here are sample wide (all pitchers, 1912-2024) distributions of them. Remember both BIP- and BNIP-ERA are calculated to reflect how many more runs a pitcher allows than an average pitcher who enjoys the same fielding support.
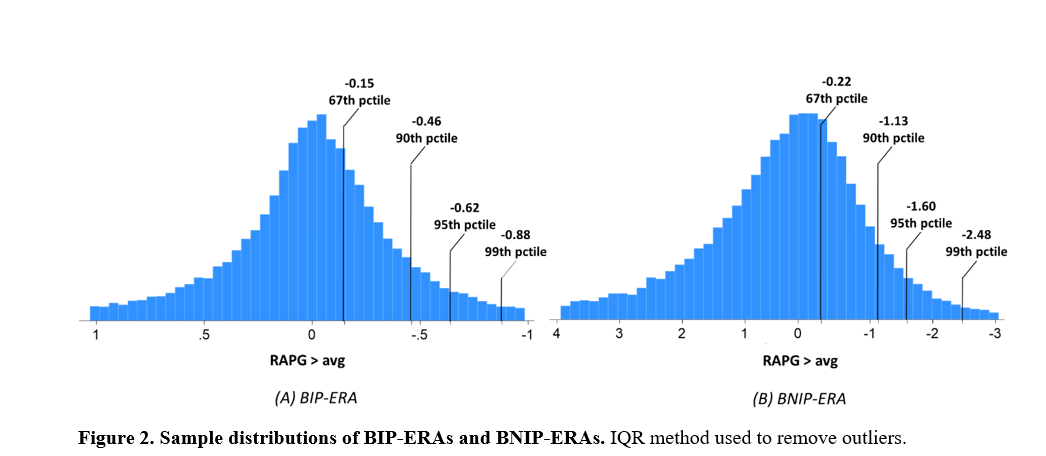
Note that the scale of BNIP-ERA is way bigger; that is, differences in ability have a bigger impact than corresponding differences in BIP-ERA.
Note too that BNIP-ERA is right skewed—that is, less spread out on the right side of the mean. That indicates that superior BNIP-ERA performers are rarer than expected compared to inferior ones. Also rarer than superior BIP-ERA performers: the distribution of that proficiency is unskewed, and otherwise pretty normal.
But this is an aggregation of performances across AL/NL history. What about over time?
Let’s take a look at the relative contribution of each to variance in runs allowed per game. BNIP-ERA expands pretty dramatically beginning in the 1980s. This is consistent with the swelling influence of “fielding-independent pitching,” which has largely cannibalized all the variance in runs allowed previously associated with differences in the quality of team fielders.
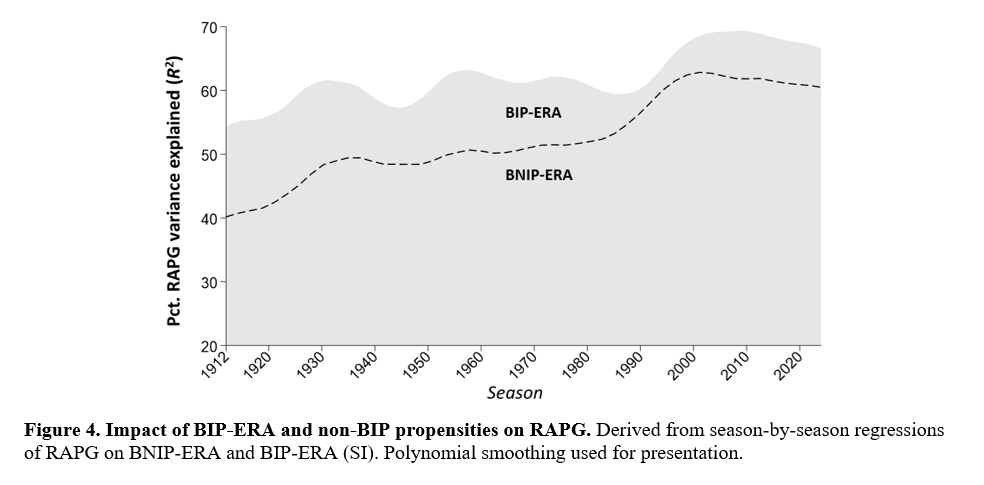
BIP-ERA’s influence is relatively uniform. But necessarily, then, it has become less consequential in relative terms as the influence of BNIP-ERA has risen.
This is basically in accord with the “conventional story” (let’s call it) that suggests the proficiency of pitchers to stifle high quality contact mattered more in previous eras of baseball history than it does today.
I think that conventional story is basically true but glosses over some things.
The difficulty comes from changes in the run-scoring environment of baseball over time. As scoring increases and decreases in response to one or another game dynamic unrelated to player talent, metrics that assess the power of pitchers to suppress runs will likewise rise and fall—but in ways that aren’t strictly related to their relative importance. As a result, the raw “runs saved” totals associated with those elements of pitching proficiency will jump around in ways that are not reliably indicative of their relative importance in the game.
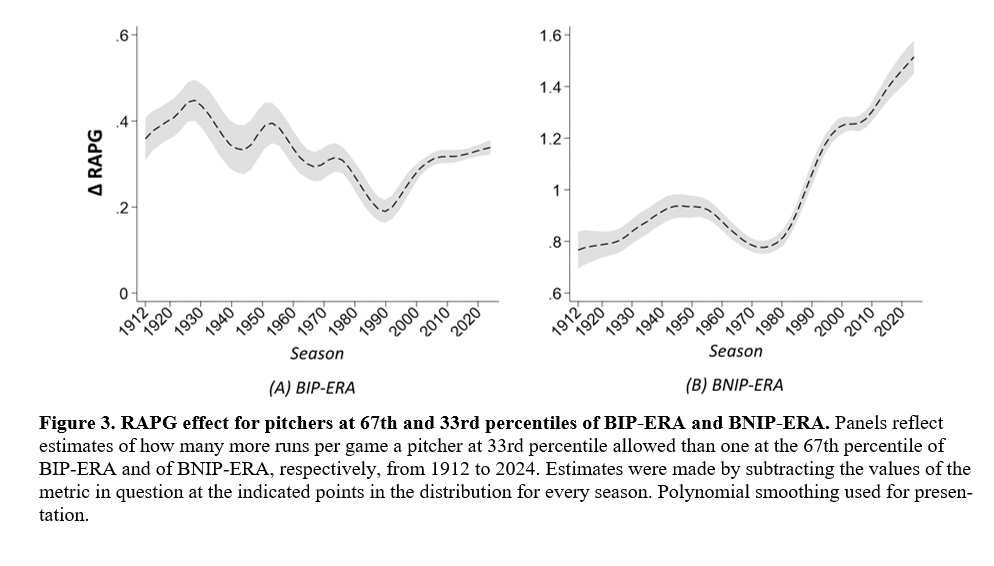 This phenomenon can be observed in changes in the spread of both BIP-ERA and BNIP-ERA values over time. From 1912-about 1990, differences between a relatively good BIP-ERA (67th percentile) and a relatively bad one (33rd) generally slopes downward (with some bumps). The same spread for BNIP-ERA is generally stable. But then both start to increase; indeed BNIP-ERA spikes in a very pronounced and sustained way.
This suggests the character of the game was starting to change at that point—and as a result BIP-ERA started to matter more all of a sudden, maybe not in relative terms but certainly in absolute ones.
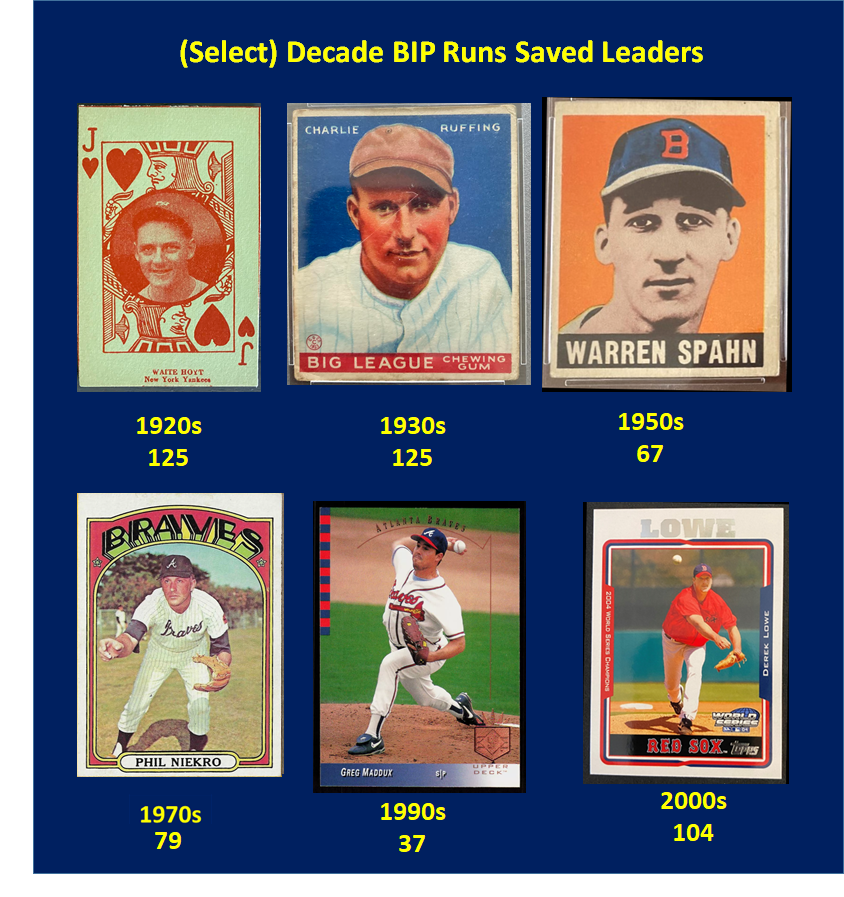
Consider these top decade performances:
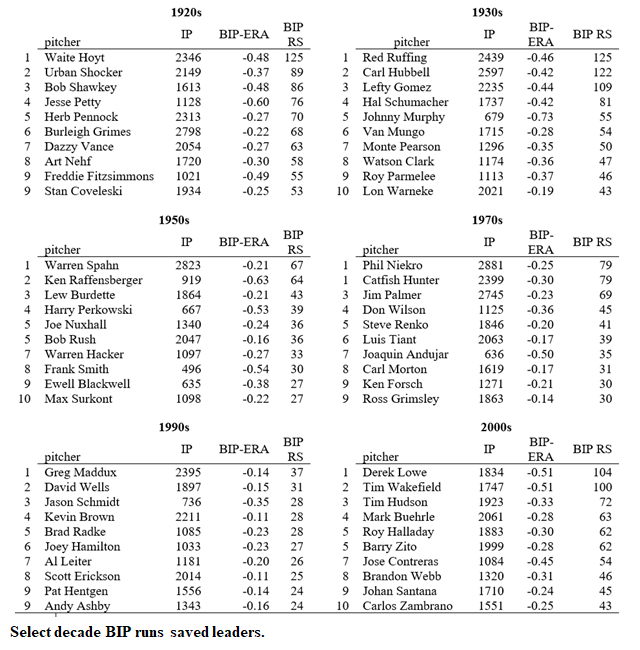
We see here that BIP runs saved—basically, the impact of BIP-ERA for 9 IP—is largest in the early years of AL/NL history. After that oy tails off, consistent with conventional story.
But then, as is suggested by the Figure above, BIP runs saved pop up again in the 2000s. Indeed, the decade-long BIP-ERAs of Derek Lowe and Tim Wakefield are astonishing—the equivalent of 90th percentile season performances sustained over an entire decade!
 Again, this result stems from a profound change in the run-scoring environment of major league baseball (likely due to steroid use, among other things) and was not—or at least not entirely—a reflection of an increase in the importance of stifling quality contact during the 2000-2009 period.
Essentially, the scale in which BIP- and BNIP-ERA were both being measured changed in ways that make it hard to draw reliable inferences as to their relative importance from their raw values alone.
There’s a way to try to avoid this distorting effect that I use in the paper. It involves standardizing runs so that they—and as a result BIP-ERA—are put on a common scale across AL-NL history. I won’t say more about that now, except to note that “standardized BIP runs saved” facilitate a more accurate picture, in my view, of both the relative impact of BIP-ERA over time and the most dominant BIP-suppressors in absolute terms.
Obviously, then, a lot going on here. And it’s all pretty darn interesting. And all presented as clearly as I can manage in the paper.
But one thing to realize is that raw (i.e., unstandardized) runs are real. So even if BIP-ERA is less important today than it was in the 20th century, it can—just does—continue to have a meaningful on-the-field impact. If you want to accurately appraise pitcher value today, you must still attend to BIP-ERA, even though assessing its significance requires doing so in conjunction with the likely more consequential measure of BNIP-ERA. . . .
BIP-ERA is not dead yet—not by any means!