You know I’m still perfecting BIP_RBA_v2, of course! But don’t worry, I won’t subject you to yet another report on my progress (as productive, frankly, as I think some of the latest adjustments to this metric have been).
Instead I thought I’d share a standardized career performance list.
As you likely recall, standardization is a statistical technique for making performance metrics commensurable over time. Raw metrics aren’t: changes in game conditions unrelated to player skill skew batting averages, OPS, fielding-independent pitching (FIP) and the like. Standardization puts those metrics on a common scale by converting them into units (z-scores) that reflect how many standardized deviations a performance is from the mean in that season.
I’ve done standardized season performances for batting average, OPS, strikeouts per 9IP, and FIP.
But I haven’t yet done a career standardized performance list. The idea is to use standardization to make career performances from different eras commensurable.
There are a number of ways to extend season-long standardization to career-long. The one I’m using is based on Michael Schell’s work. He uses a suite of statistical strategies to try to answer the question “who was the best hitter ever”; standardization is only one. But he turns season-long performance scores into career ones by weighting each season’s performance in proportion to its contribution to a player’s total career as measured by the metric-appropriate weighting variable—ABs, IPs, etc. (although he also factors-in age-related declines; he’s got all the bases covered!).
So that’s what I did here. You might recall that FIPr uses regression analysis to determine how many runs a pitcher is “personally responsible for”—on the basis of HR-allowed rate, strikeout rate, BB-rate, and HBP-rate, all of which are “fielding independent.” I calculated very AL/NL pitcher’s season standardized FIPr (weighting for innings pitched) for 1900-2024, as I did in the previous post.
Then I summed the product of each season-long standardized FIPr by IPs and divided that sum by the pitcher’s career IPs. That generated an “average” season FIPr z-score.” I made this career calculation only for pitchers who threw ≥ 1000 IPs, since career performances require a fair minimum qualifying threshold.
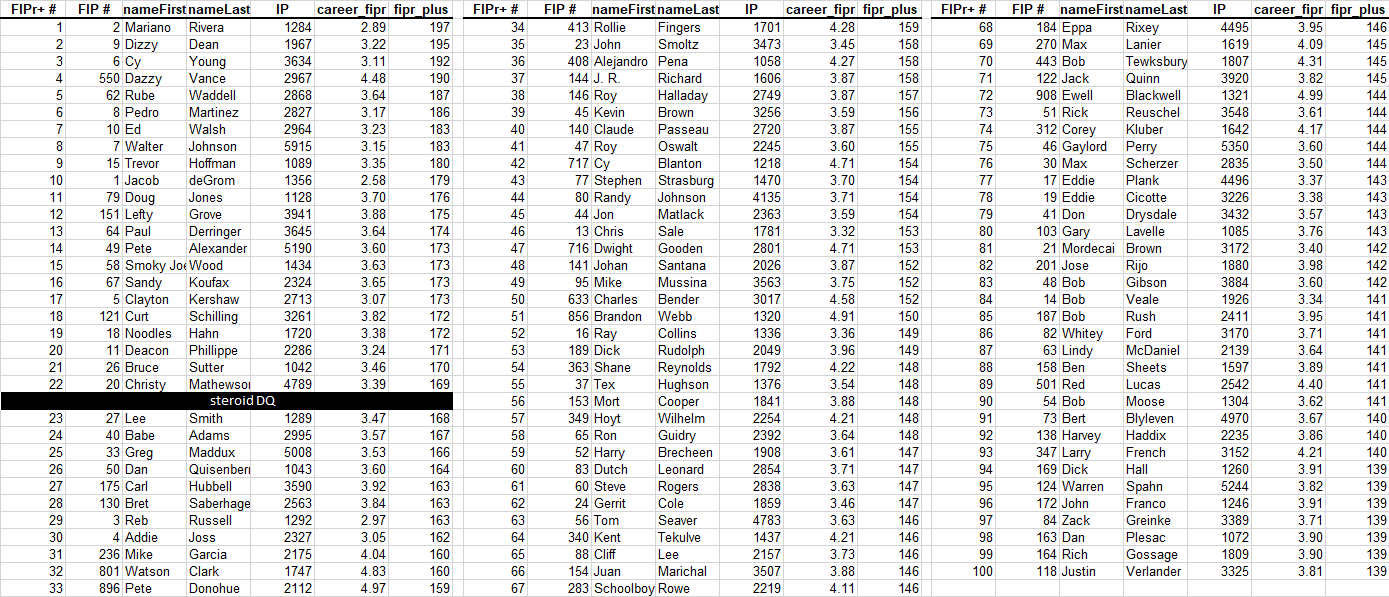
I then normalized the averages, putting them on a scale with a mean of 100, creating an index akin to the familiar OPS+ score. So let’s call this every pitcher’s “career FIPr+.”
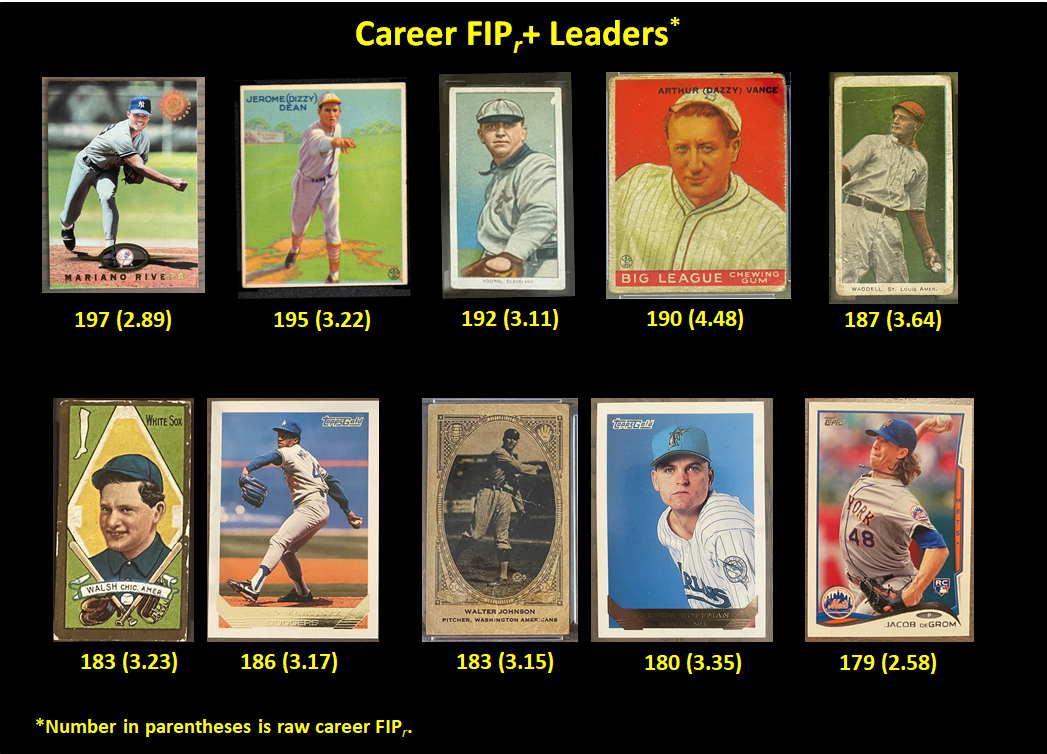
Here are the top 100:
The coolest thing about this is how representative it is of different eras, including ones in which the raw FIPrs of the featured pitchers vary substantially. Pretty neat, in particular, to see that Dazzy Vance, who is ranked 550th in raw career FIPr at 4.48, is 4th in career FIPr+.
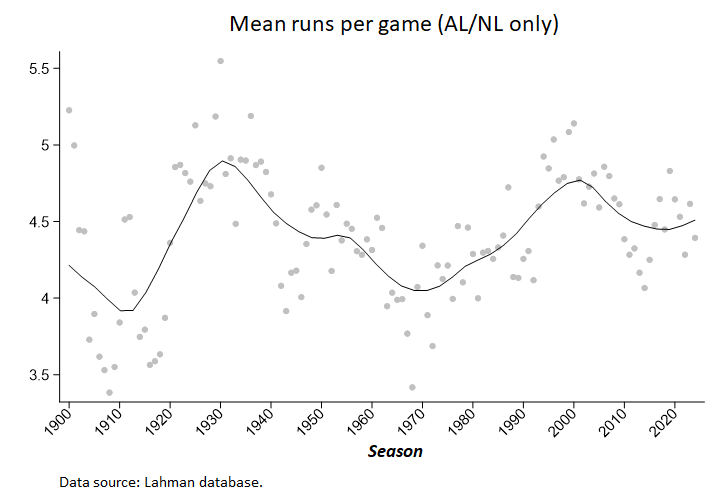
That’s the whole point, of course, of standardization. Run-scoring has varied dramatically over different eras of the game, for reasons that obviously do not reflect wild fluctuations in the availability of high-quality pitchers. So it really is pointless to look at raw metrics—here FIP, but same goes for any baseball rate statistic—if we want to understand the relative dominance of players from different time periods.
How much more dominant was Vance than others? Sources tells us that this sort of scale rates players in “percentage” terms relative to the mean, but I actually find that pretty confusing. Mariano Rivera scores 197 on FIPr+. Does that mean he was “97% better than average”? What does that even mean? (I’m just as confused about this with OPS+, ERA+, etc.).
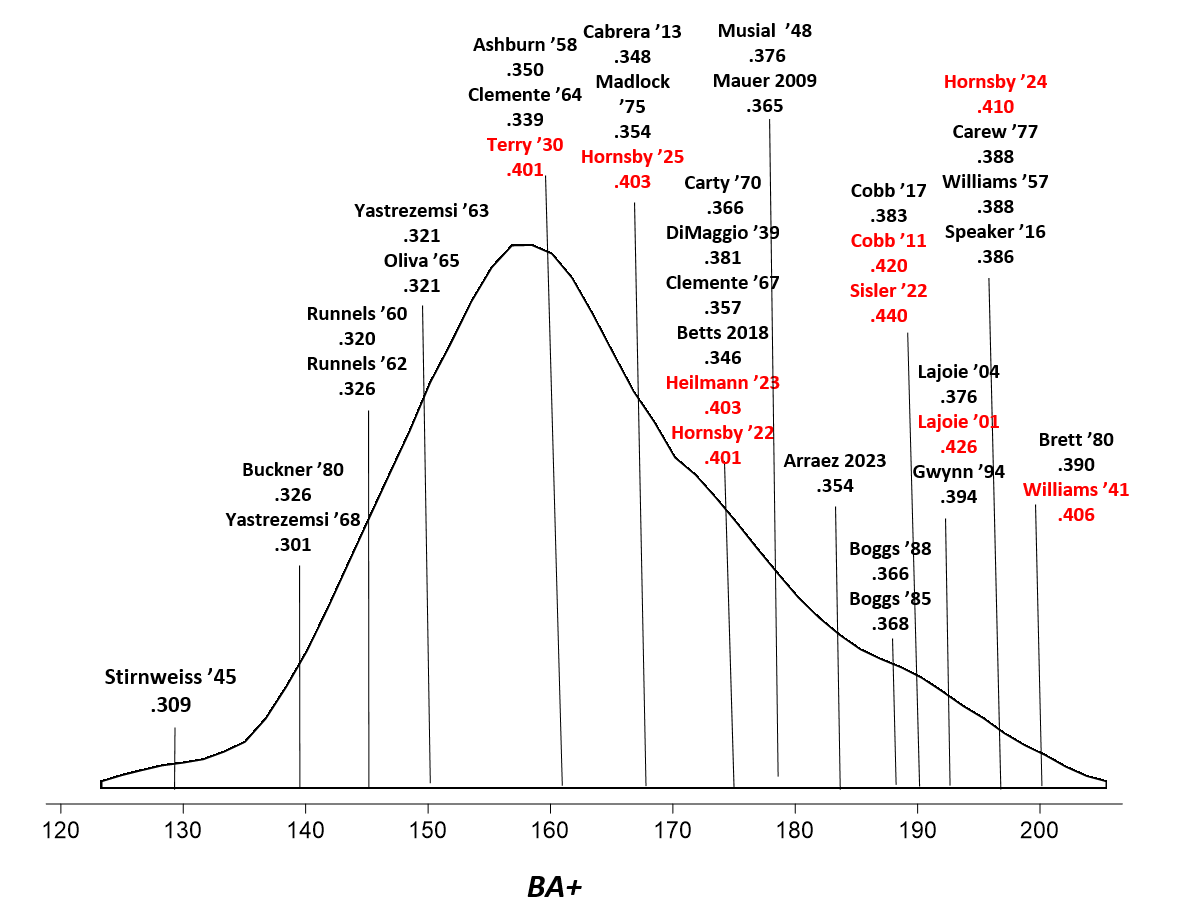
A z-score, in my view, is more informative. Rivera has a career average FIPr z-score of 1.55—which is equivalent to the 94th percentile in a normal distribution of scores for a season. It’s pretty crazy to manage to be that dominant on average for the length of Rivera’s career; it would be like batting .340 every season in the 1930s and early 1940s (or (.333 in the late 70s etc.). (We should note, of course, that Rivera, because he was a reliever, only pitched 1200 innings; still he remained a dominant closer for an astonishing number of seasons.)
Dazzy Vance, with his 4.48 raw career FIPr has an average z-score of 1.47, or effectively the 86th percentile for a typical season. A single season like that is very very good. Well, Vance averaged that over 16 seasons as a starter, throwing some 3,000 innings. That many seasons of very very good (including some in which he was even better than that) make for a career or rarified excellence.
I’m reluctantly using the 100+ scale because I accept that most people find z-scores pretty alien. But I hope I’m enticing you to become more comfortable with them, if you aren’t already.
Indeed, if you want to see the z-scores and otherwise explore the data for yourself, they are where they usually are!