Postscript, 4.23.25: This post was a first shot; for better analysis, go here.
So how about knuckleballers? Do they throw balls that, when hit, are easier to field?
This is often claimed. Their BIP_RBARb seems to support this position.
BIP_RBARb stands for “balls-in-play runs below average,” with b denoting “beta”—because construction of this metric is expected to be refined and improved.
A pitcher’s BIP_RBAb measures the impact of his propensity to confine hitters to infield pop ups and ground balls. As its name implies, the measurement is in terms of runs allowed per game relative to a pitcher with average tendencies in those regards. I described BIP_RBAb derivation in the previous post.
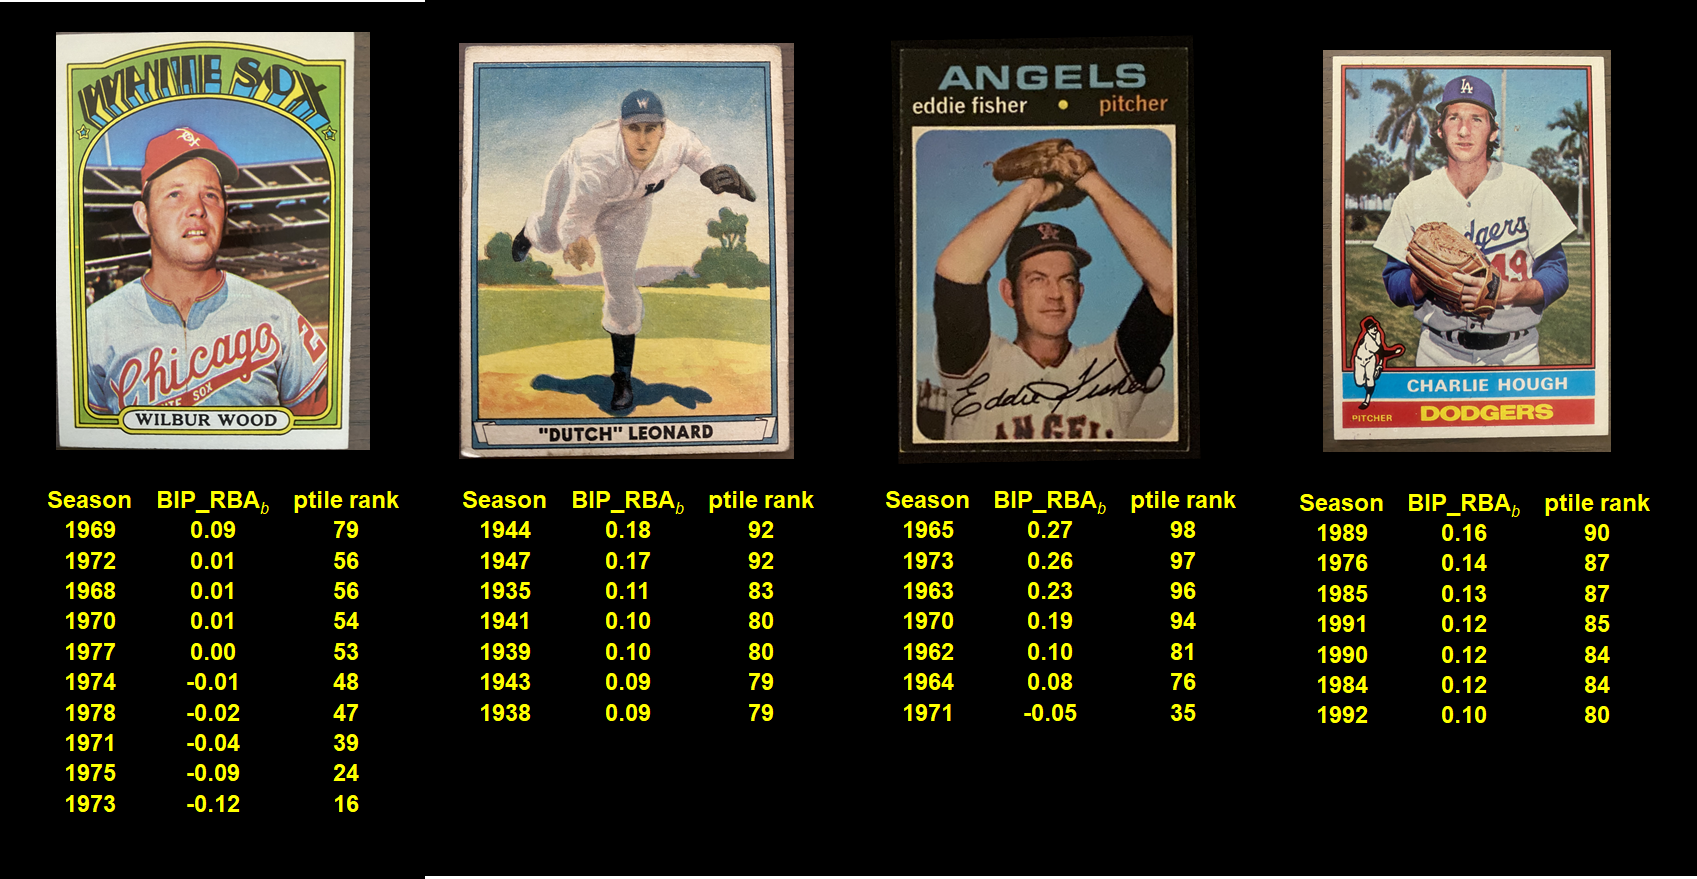
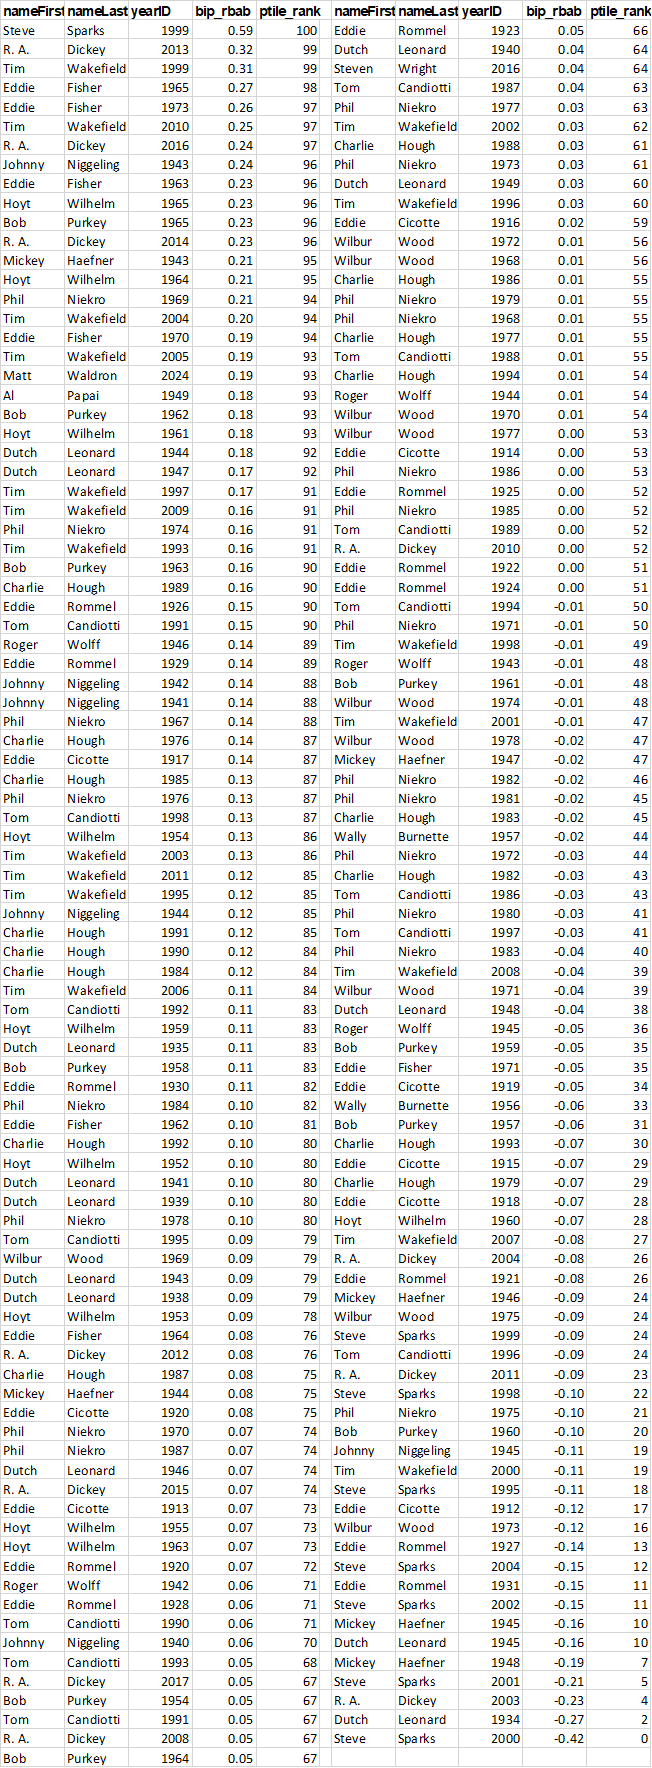
At the bottom of this post is a list of season BIP_RBAbs for pitchers who threw ≥ 100 innings and who have been identified by Rob Neyer as relying principally on the knuckler. There are 187 seasons in that category out of 13,078 total.
The results look pretty interesting!
Consider Tim Wakefield. He recorded 6 seasons that ranked in the 90th percentile or above for BIP_RBAb among all pitchers who threw ≥ 100 innings and another 2 above the 80th. Not bad! (He missed top 6 in the last post, which focused only on hurlers with ERA-qualifying IPs.)
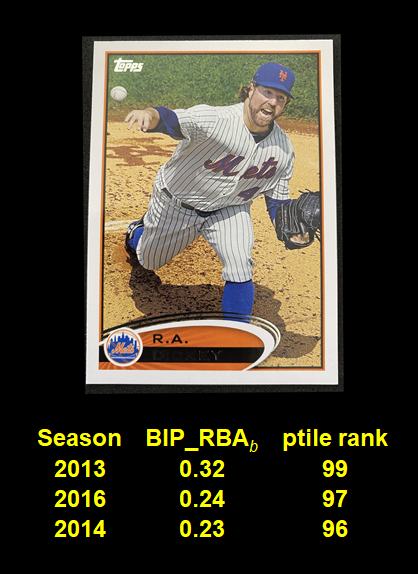
 R.A. Dickey had 3 such seasons, and in brief career.
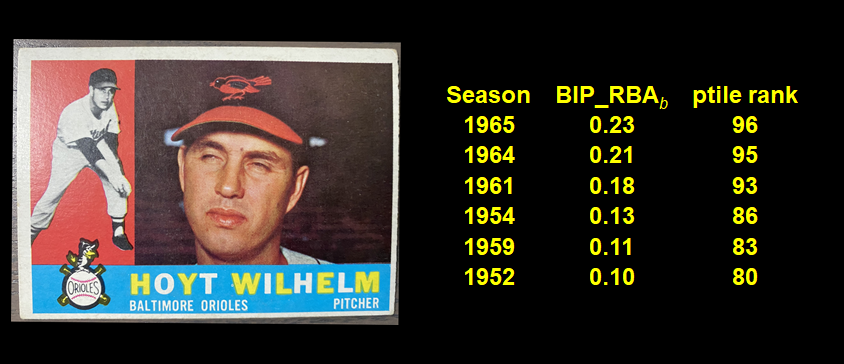
Hoyt Wilhem 3 also, over an extremely long tenure—but with other solid performances.
Eddie Fisher—5 +90th percentile campaigns!
Phil Niekro had 1 90th+ percentile season, and 3 at the 80th or above. Pretty darn good!
But Dutch Leonard and Charlie Hough had consistently high BIP_RBAbs.
On the other, hand, Wilbur Wood had petty mediocre BIP_RBAbs.
And Steve Sparks is at both the top and bottom for all-time season rankings!
 We need to be careful here. Selectively sorting through a list like this is a recipe for confirmation bias.
To approach this more rigorously, we should calculate how much more likely a knuckler is to turn in a superlative performance on this metric than a randomly selected pitcher with comparable innings pitched.
As a first cut, an IP-weighted logistic regression suggests that the probability a knuckleballer will turn in a BIP_RBAb performance in the 90th percentile or above is about 14%. Since any pitcher drawn at random would have a 10% chance, we could estimate that being a knuckleballer generates a 40% increase in the probability of turning in a performance this good.
By the same logic, a knuckleballer is 50% more likely to record a season BIP_RBAb in the 80th percentile (30%) than the average pitcher.
There are even more exacting ways to do this, but this is good enough for now, given that there is still more to do to perfect BIP_RBA.
So provisionally, I think this result tends to validate both BIP_RBAb and the common belief that knuckleballers yield more easily fielded batted balls. BIP_RBAb‘s power to isolate run-stifling hit propensities is bolstered by its high-rating of knuckleballers; and the common perception of knuckleballers—which derives from a relatively ad hoc examination of their opponent BABIPs (opponent Batting Average for Balls Hit in Play)—is bolstered by their disproportionately high BIP_RBAbs. This simultaneous bolstering is not circular, by the way: if you find what looks like a piece of a puzzle, and also what looks like a puzzle that’s missing a piece, each surmise becomes more likely if the former fits the latter.
But did someone say opponent BABIP?. . . stay tuned!
Oh—I’ve updated the BIP_RBA data and analysis script to include a knuckleball identifier code in case anyone else wants to futz around.