It had to be done.
Well, not really. But I did it because I’m still collecting examples of season-by-season trends in performance standard-deviations for the purpose of testing the Gould conjecture.
In this case, “it” was the compiling of standardized strikeouts per 9IP. That was essentially a natural byproduct of the aforementioned testing, which required computing season-by-season K/9IP weighted means and weighted standard deviations, something I did based on the performance of every AL/NL pitcher who threw ≥ 100 innings from 1900-2024.
With that data I calculated each pitcher’s season-specific K/9IP z-score, which reflects his performance relative to the mean pitcher’s performance that year. Placed on this common, standardized scale, we can rank their season marks free of the distortion associated with performance-unrelated variability attributable to changing game conditions and the like (I’ve done this for batting averages, OPS, and FIP; those posts furnish more involved explanations of this process).
I knew all 15,036 regular readers of this blog would be interested to see that!
But first consider:
Insane, huh? The march of increasing strikeouts has been inexorable since the beginning of baseball (maybe even before then). By 3075 it will exceed 27 K/9IP, necessitating elongation of MLB games.
Even crazier: the relentless increase in standard deviations or variability across pitchers along this dimension of performance. If he were alive today, Stephen Jay Gould would be rolling over in his grave! (I won’t rehearse the significance of this either, but you can read up about it here, among other places). [Note: take a look at this post. It dispels this particular anomaly! The season-over-season SDs are not supplying an accurate impression of the trend in variability here; nevertheless, they remain correct for determining the season-specific z-scores.]
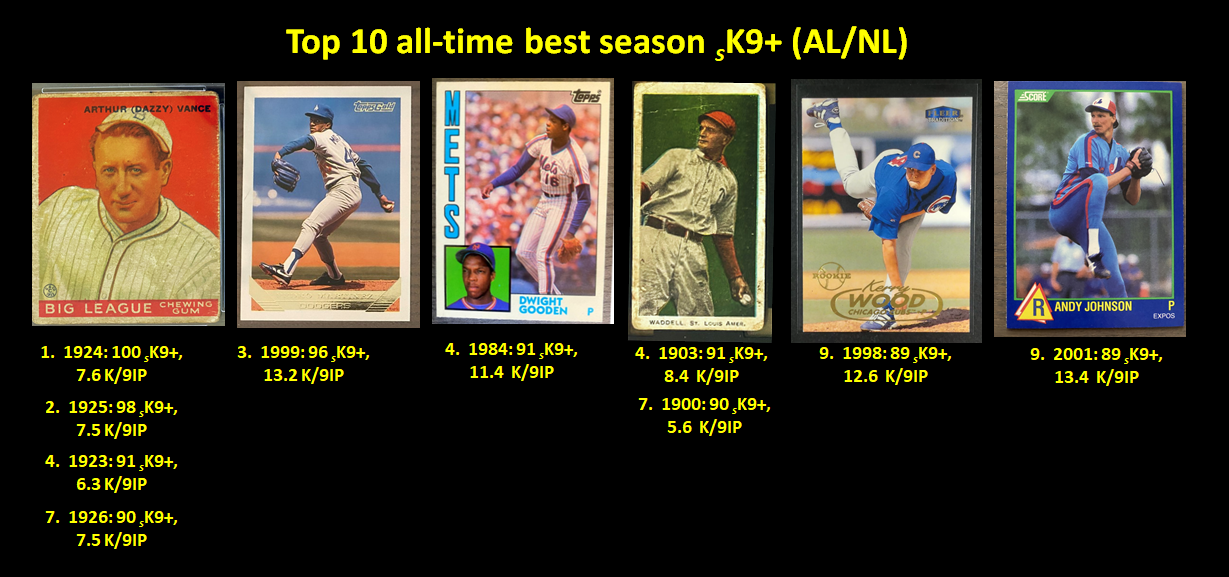
Enough suspense! Here are the 10 most dominant standardized K/9IP performances ever.
The metric “sK9+” refers to the season-specific standardized strikeout per 9 innings pitched normalized to a 0-100 scale for all 8461 pitchers who pitched sufficient innings to qualify for an ERA title over the course of AL/NL history (I’ll do Negro Leagues too once my go-to source, Lahman database is enlarged to incorporate them or once I get sick of waiting for that and collect the necessary data myself).
Dazzy Vance was a friggin’ monster! Rube Waddell, too!
The thing to realize, of course, is that strikeouts were much harder to compile before baseball’s “Great Transformation.” Hurlers who averaged 6-7-8 a game were for decades multiple standard deviations ahead of the mean.
Now a pitcher who posts 9 K/9IP isn’t much better than average!
Go back and check out those scatterplots at the top.
It’s a whole different ball game, folks, something the examination of standardized fielding-independent-pitching also highlighted.
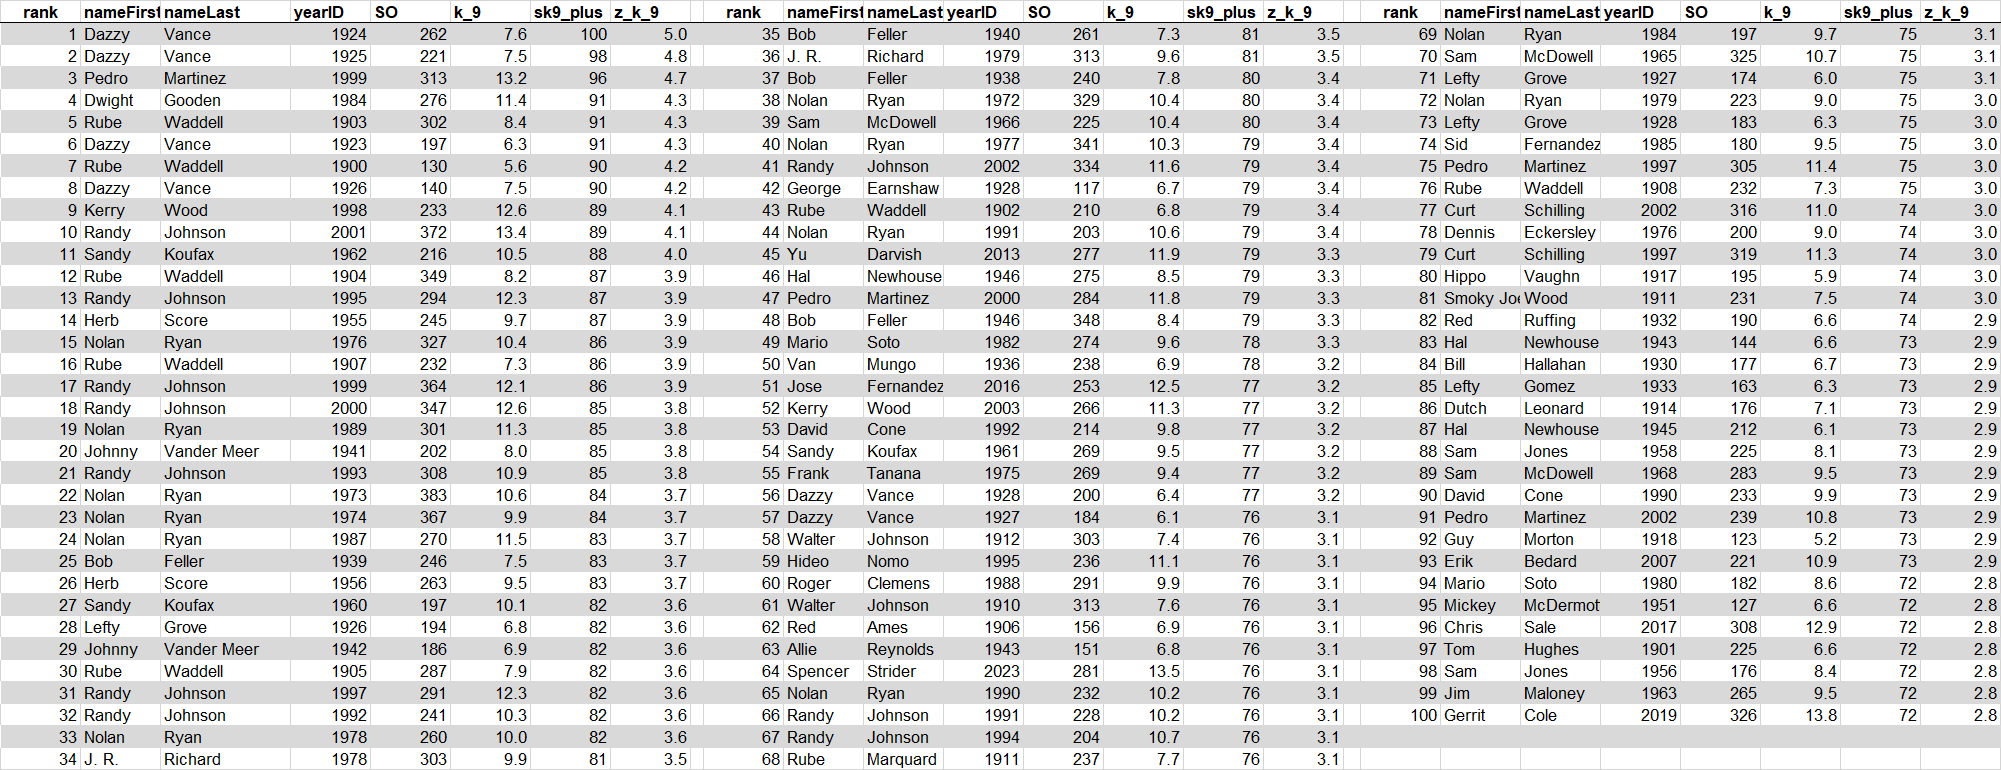
For your edification, amusement, befuddlement, etc. the top 100 sK9+ rankings appear below (click on it and it will get big enough to read; I swear!).
If you want to take your own trip into the baseball numbers twilight zone, head over to the stats parlor, where the data and analysis scripts used to construct sK9+ are yours for the downloading.


