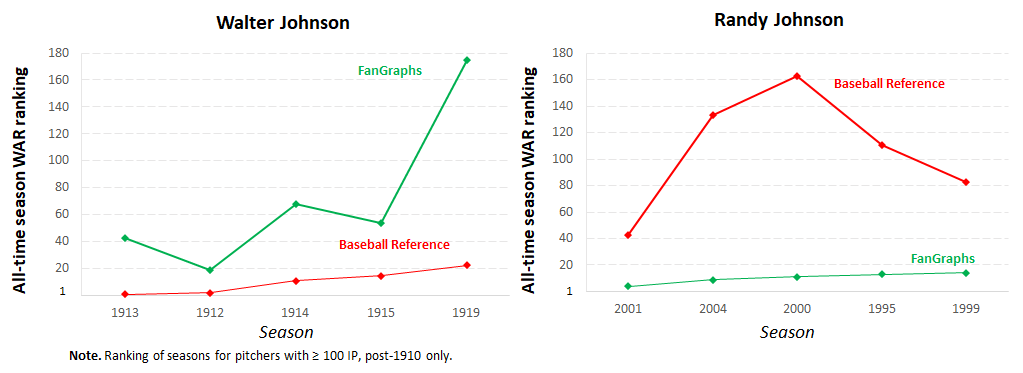
I noticed this pretty much by accident as I was examining something else, and I thought it was pretty interesting: Baseball Reference and FanGraphs obviously disagree about the value of the five best single-season pitching performances of baseball’s most high-profile Johnsons.

I think I know what’s going on here. FanGraphs bases its preferred pitcher WAR calculations on fielding-independent pitching (FIP), albeit with some adjustments, whereas Baseball Reference uses an “expected/actual run differential” formula. FIP is a metric that favors pitchers from the last three decades or so, the period in which strikeout rates have surged.
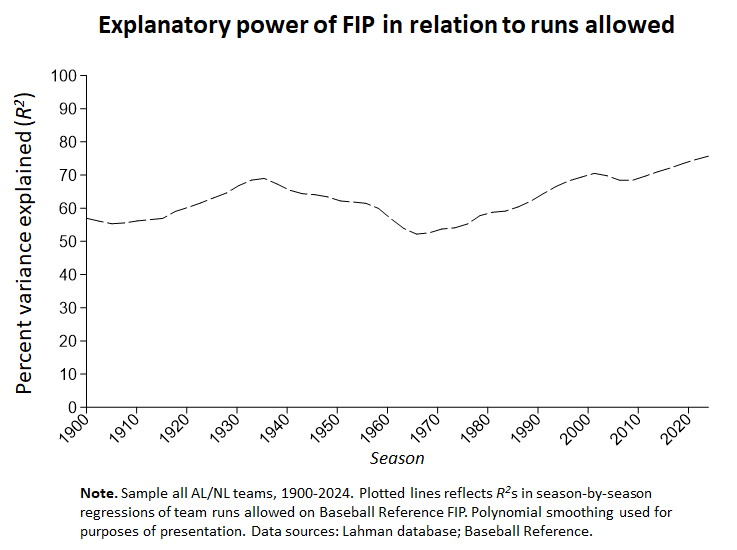
FanGraph’s choice makes sense for pitchers of the “Great Transformation” era (the period in which the game has become dominated by the strike-out/home-run showdown), because over that period FIP has become responsible for a greater and greater share of the explained variance in team runs allowed. That method might, however, be less appropriate for earlier-era pitchers, whose performances are being slighted on the basis of a performance characteristic that arguably was less critical to pitcher success (that’s what I was studying when I noticed the Johnson-measurement disparity between BBR and FG; I’ll post on that when I have sorted out my thoughts a bit more).

All this said, it would be a mistake to make too much of this disagreement. In the case of Randy, the actual units of WAR don’t vary that much, as can be seen in the table below, and as can be seen in FG’s and BBR’s reasonably close career WAR estimates (110.5, 101.1, respectively). The conflict is a bit more consequential for Walter, though (FanGraph’s career: 116.1; BBR: 166.9). Still, overall the correlation between FG and BBR WAR’s is reasonably good (r = 0.79, for the post-1910, ≥ 100 IP sample I was studying).

Anyways!

