I really, truly did think I was done talking about fielding, at least for a good while.
But then Sean Smith dropped a file with comprehensive OAA—Outs Above Average—scores for 1912-2024. The OAA “Total Fielding Runs” (TFR) measure is pure gold. Gold on steroids.
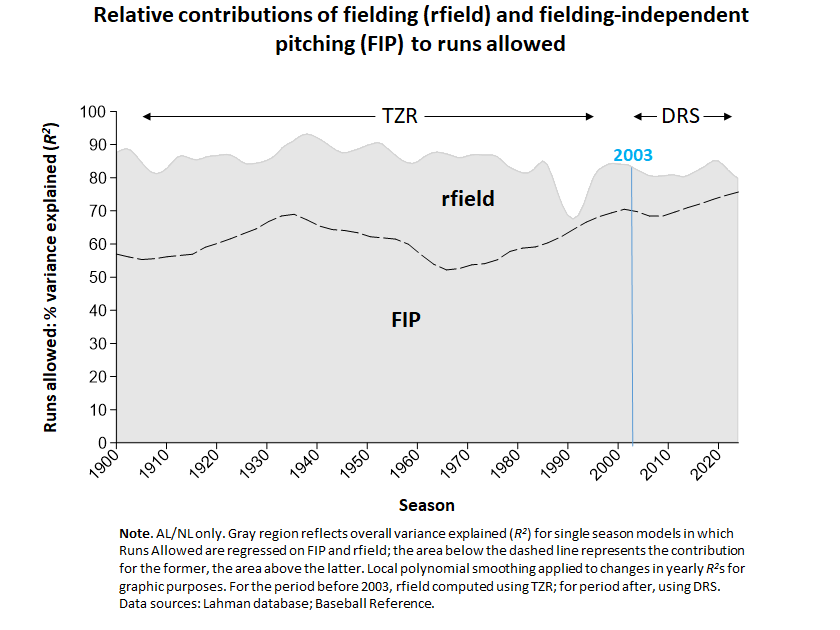
First, recall what the relationship between fielding and pitching across AL/NL history looked like in previous posts:

That unsightly hole in the 1990s was not a consequence of a breakdown in fielding during that time. Rather it reflected a period in which Smith’s Total Zone Rating (TZR; used by both Baseball Reference and FanGraphs for computing WAR) was degraded by reliance on bad data from Retrosheet’s “Project Scoresheet” companion (Smith 2024).
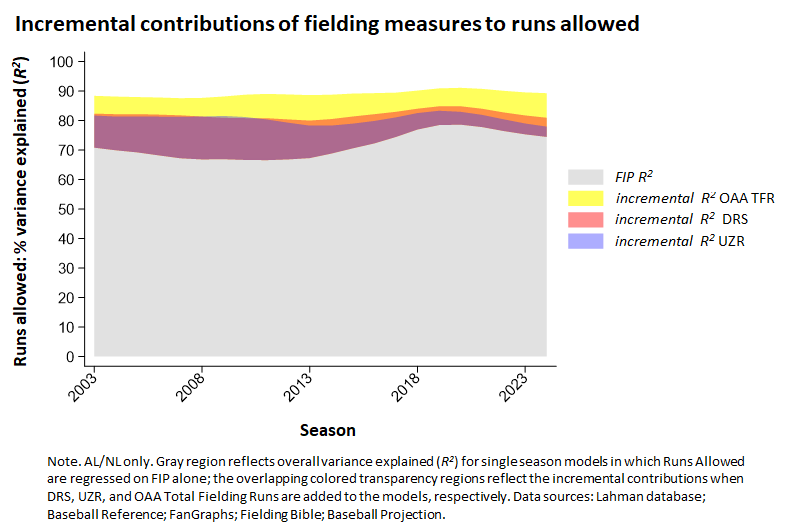
Well now take a look!

With the benefit of the TFR metric for fielding runs saved, the 1990s gap is plugged!
 And that’s not the only benefit of Smith’s OAA ratings.
Note that in the second figure, I’m using TFR not only for the period between 1990 and 1999, but also for the period after 2002, in which Baseball Reference uses Defensive Runs Saved (DFR). Fangraphs over this period uses the related Ultimate Zone Ratings (UZR) metric. Both of these fielding measures are derived from data generated by Baseball Info Solutions, which combines digital tracking with formulas that reflect the probability of successful fielding of balls hit to one or another region of the diamond.
Well, it turns out that the OAA/TFR measure outperforms both DRS and UZR. By a lot. Whereas those measures explain around 10% of variance in runs allowed (a bit less for UZR) over the period in which they are in use, TFR explains 20%—a 100% improvement!

That really blows me away, given the admitted sophistication of DRS and UZR. For sure it supplies reason to reject the oft-repeated, but apparently never seriously investigated, claim that pre-digital measures of fielding shouldn’t be regarded as reliable.
But wait—that’s not all!
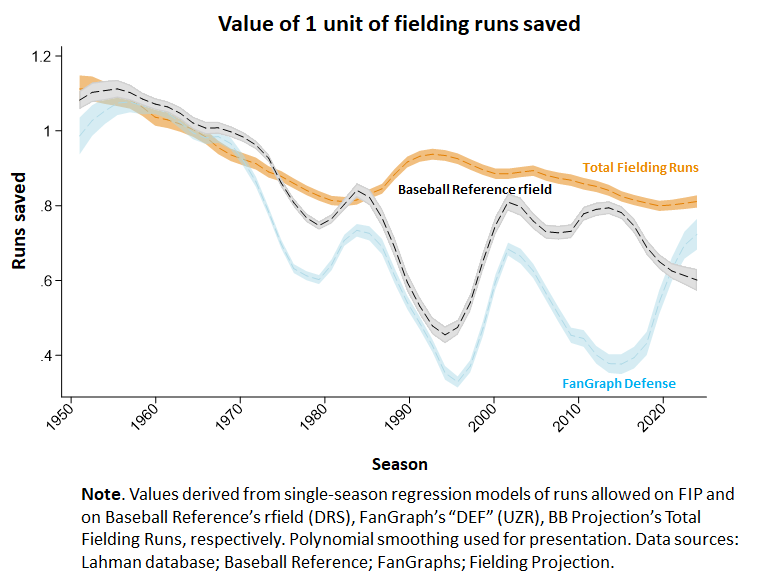
TFR outperforms the digital metrics in still one more dimension: calibration.
In previous posts, I’ve described the phenomenon of “rfield inflation,” the progressively growing over-estimation of how many actual runs are saved by a unit of Baseball Reference’s and FanGraph’s fielding-runs saved measures (rfield and DEF, respectively). For example, a unit of rfield was worth 0.50 runs in 2024; a unit of DEF was worth 0.75 last season but after dipping as low as 0.42 in 2021.
As can be seen, the OAA/TFR measure reflects a much closer, and much more consistent, correspondence to true runs saved.

I earlier showed how “rfield inflation” had distorted the appraisal of the value of career fielding performance by third baseman, pushing Clete Boyer to 6th on Baseball Reference’s all-time fielding-runs saved list from what, if rfield inflation were corrected, would be 2nd.
Sure enough, on Smith’s OAA/TFR ratings, Boyer is second in third-base fielding runs saved (166). He scores higher than Adrian Beltré (116), Scott Rolen (159), Nolan Arenado (120), and Buddy Bell (163), all of whom are ranked ahead of him on BBR’s list as a result of the biasing effect of rfield inflation.
So, do you forgive me for returning to this topic?
I’ve uploaded Smith’s TFR data calculated at the team level, and updated the “fielding shrinkage” script, to reflect the analyses here.


6 Responses
I try to stay humble with this, I don’t want to disparage the work of others. There is a reason DER OAA is going to correlate almost perfectly with runs saved at the team level, that is because by definition the DER for all the players will add up to the DER of the team.
That does not mean necessarily that the DER of individual players will be any more accurate than fielding ratings from other systems.
I’m glad you’re doing this work, I definitely can’t do it all on my own.
Hi, Sean. Thanks for the response! Maybe you are being a bit humble here?
Correct me if I’m wrong, but OAA estimates of a player’s fielding-runs saved aren’t derived from the actual number of runs given up his team. They are based, essentially, on the fraction of fielding opportunities a player turns into outs compared to the league average for players at his position.
For sure the team estimate will correlate perfectly with the sum of its players’ individual runs saved; it has to because that’s all the aggregation is.
But that doesn’t guarantee that the team estimate, so derived, will actually explain *any* amount of variance in team runs allowed. Differences in team-level fielding-runs saved will explain team-level variance in runs allowed only if the *player-level estimates* that are being aggregated are accurate. (And of course even then, the amount of variance explained will never perfectly correlate with differences in team runs allowed; no measure can be expected to be that good!)
Teams’ DRS and UZR scores are derived in exactly the same way: by aggregating the estimated runs saved by their individual players.
So the differing amounts alternative fielding measures add to runs-allowed R^2s *at the team level* necessarily do tell us which metric is most accurately measuring fielding proficiency at the *individual level.* Measuring variance explained at the team level is in fact the only way, I think, for validating schemes for measuring individual-level fielding proficiency.
I agree, of course, that the other systems are also valid — indeed awe-inspiring given how difficult it is to make estimations of this sort. If I implied otherwise, that just shows I’m not as good at writing as you and the inventors of these systems are at figuring out how to measure baseball performances–which I’m sure is true….
But for now, I like the OAA system for estimating fielding runs saved best.
Are you aware that Rfield (total zone) on BBRef is highly regressed for outfielders who played before 1953? There’s a reason why no OFer who debuted before the 1950’s has a Rfield over 92. I assume that would have some impact on your research.
Hi, Jeffrey. I wasn’t aware–thanks! I have to admit–w/ embarrassment that I’m sure will be compensated for by expanded knowledge–that I’m not sure what exactly it means for “BBRef [to be] highly regressed for outfielders….”. I’d be grateful if you explained or pointed me toward sources that do.
I will say, though, that whatever was being done with the measure before 1953, it didn’t seem to be having a detrimental effect on rfield’s power to explain variance in team runs allowed (after controlling for FIP). But as “rfield inflation” shows, explanatory power & calibration are different. That is, differences in rfield at team level can still do a great job in explaining variation in team runs allow but while being measured in raw units that don’t correspond well to runs scored (something you can tell by looking at the beta weight in a mutivariate regression: they should be around 1.0 if a rfield is calibrated appropriately). If you are telling me that rfield’s calibration is connected to the 1953 value of the inputs it relies on, that would be very interesting.
But your point might mean something different entirely. I’m eager to learn more.
By regressed I mean reduced. I believe Tris Speaker is tops among all pre-1950 OFers in Rfield with 92. Sean Smith originally calculated much higher Rfield numbers for Speaker. Baseball Reference later reduced his total Rfield by quite a bit. That’s why no pre 1950 outfielder has a Rfield over 100.
Some examples of Smith’s original Rfield calculations are found here: https://lanaheimangelfan.blogspot.com/2009/06/outfield-ratings-for-pre-retrosheet.html
I just discovered your site today and enjoy your work very much though admittedly my understanding of it is pretty low at this point. Like you I have a high regard for OAA fielding runs though there are a few other fielding metrics that IMO have merit as well for pre-statcast era players. Rfield/TZ from 1953-1990 is pretty decent I’d say.
Ah, I see. That’s quite interesting, thank you. I’ll definitely take a look at this. I really love BBR and FG, but I do find that some of the “adjustments” they make to well considered metrics detract from their explanatory power.
I’m glad you found the site, and grateful for the feedback. I try to supply as much raw material as possible so anyone motivated to engage critically with or extend the analyses can–best way to learn, and to reciprocate the benefit I’ve already received from the work others (e.g., Sean Smith) have shared. Definitely let me know if you see anything amiss or if you have competing conjectures (which I’ll happily test if I can)