 I’m interested in pitching evaluation metrics (who isn’t?!). Recently, I’ve been trying to understand what drove differences in pitcher proficiency throughout most of the twentieth century. We know that strikeouts are pretty much everything now, but that wasn’t so then. What sorts of factors most influenced pitching proficiency in the 1950s, say, and what is their relative power today?
The obvious metric to focus on is “fielding-independent pitching” or FIP. As an index comprising nothing more than the propensity of a pitcher to strike batters out, walk them, hit them with a pitch, and allow home runs, it’s not surprising that the power of FIP to explain differences in runs allowed has soared over the last three decades or so, as both strikeout rates and home runs have soared. But before baseball was all about HRs and Ks, what set pitchers apart?
I thought it would make sense to decompose pitcher WAR in relation to FIP to try to get at this. WAR has measured pitcher proficiency over the entirety of baseball so why not figure out what mattered more when FIP mattered less?
But having ventured down that path, I am starting to wonder whether it makes sense to use any metric other than FIP to explain differences in pitcher performance at any point in the history of major league baseball.
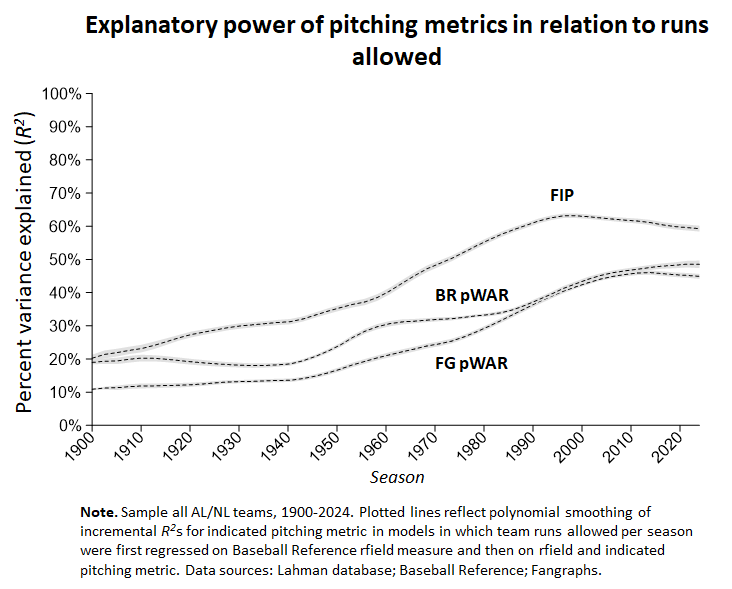
Consider this graphic. It examines the influence of FIP and the respective pitcher WAR measures of Baseball Reference and FanGraphs on runs allowed, holding differences in fielding proficiency constant. (So there’d be a common fielding control, my regression incorporated Baseball Reference’s rfield, which for most of MLB history has been based on the same sources as FanGraph’s defensive war metric and unsurprisingly is highly correlated with it).

What we see is that FIP has always outperformed both versions of pitcher WAR. By a pretty decent margin, in fact.
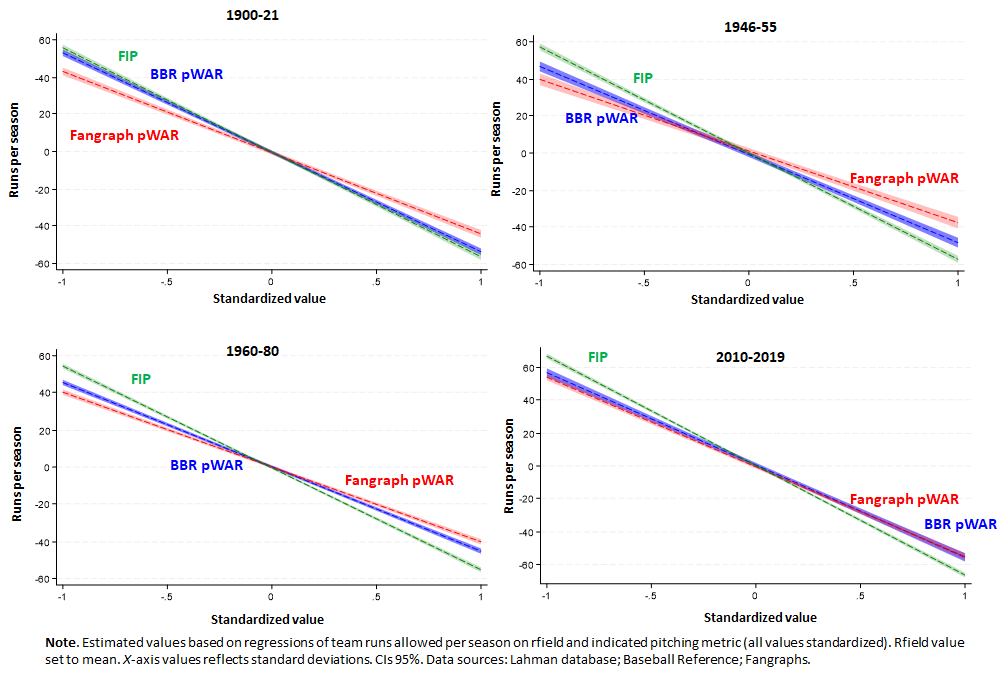
To make the significance of this explanatory gap more concrete, consider this graphic. It shows the impact in runs allowed per game as team pitching performance deviates from the mean on the various metrics over various major league baseball eras.
In the seasons between 2010 and 2019, FIP captured about a 25-run per season differential relative to BBR’s and FanGraph’s WAR measures in the proficiencies of pitching staffs at the 33rd (-1 SD) and 67th (+1 SD) percentiles in major-league effectiveness.
That’s the impact for “today’s baseball,” where strikeouts battle home runs. But the advantage for FIP was comparable, and at various points larger, over most of the last century. There was rough parity between BBR’s measure and FIP in the dead ball era.
I have to say, all this surprises me. A lot. It’s not at all what one would expect, not given how the game has evolved, and not given the explanations of how Baseball Reference and FanGraphs calculate their pitcher WAR measures (FanGraphs actually uses a version of FIP that it has modified in various respects).
But that’s what I see in the data. Have a look for yourself if you are interested.
In any case, I haven’t advanced a centimeter in this exercise toward identifying how pitchers who didn’t record upward of 10 Ks per 9 IPs managed to dominate before the 1990s.
Should I give up?
I don’t think I’m going to. . . .

